Evolution of the
Luxembourg banking industry
Luxembourg banking insights 2020
What has changed in 2019? KPMG presents its annual analysis of the banking market based on statistical and annual accounts data.
In collaboration with
Size of the Luxembourg banking industry:
2016 to 2019
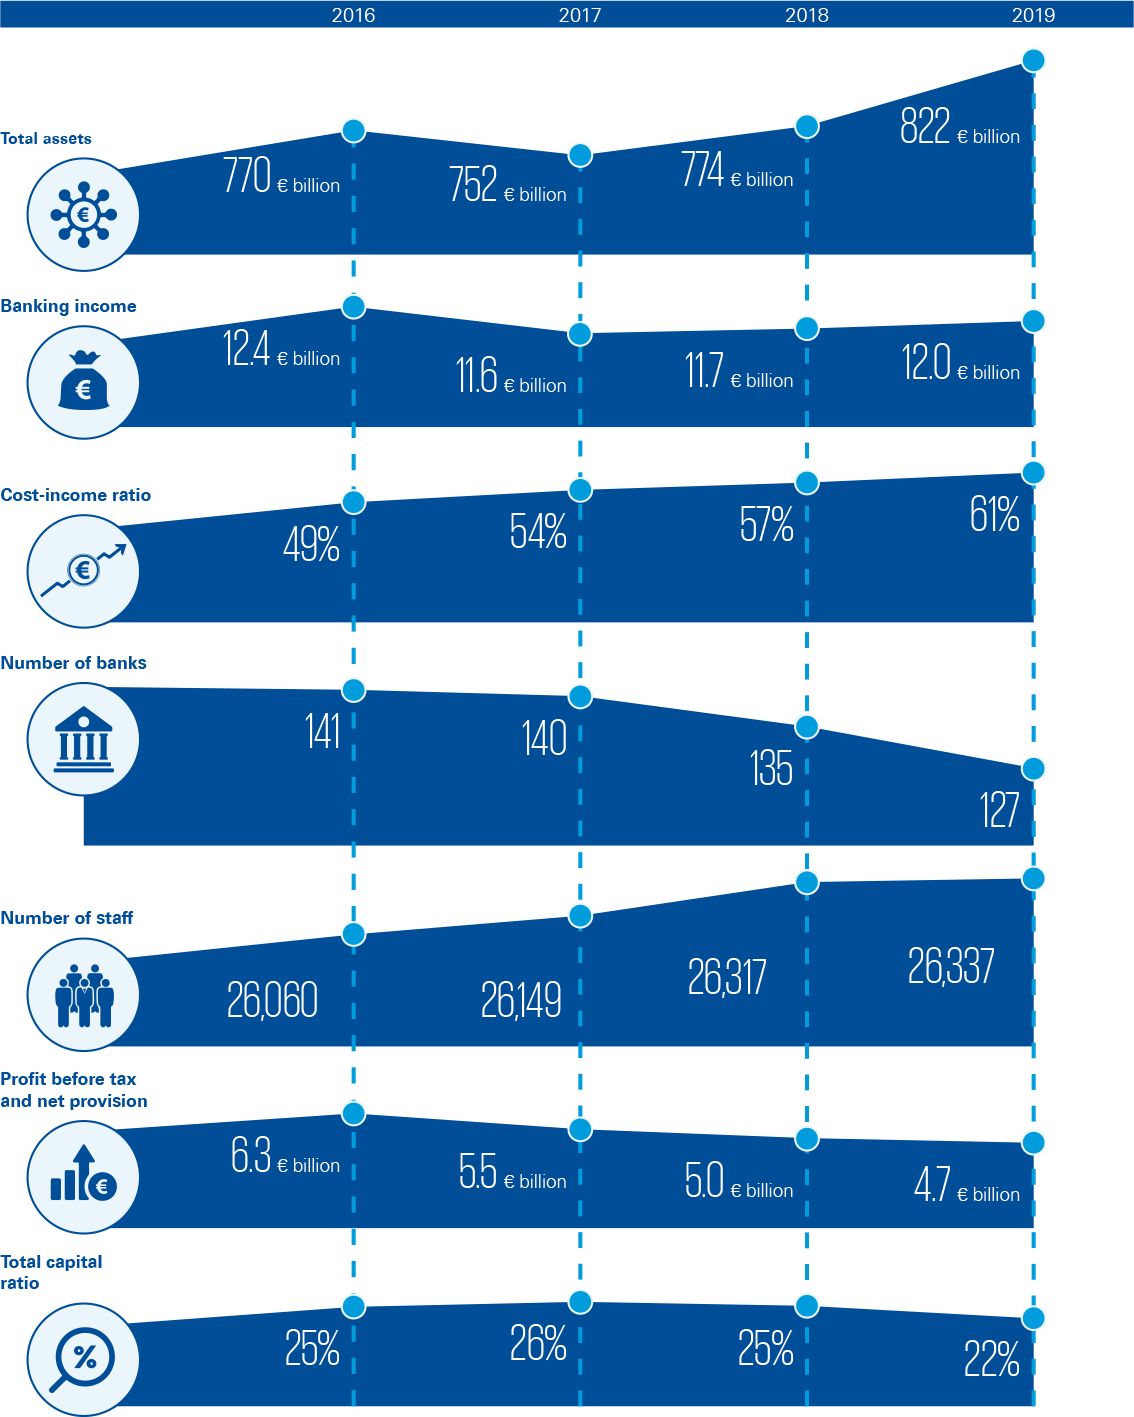
Source: CSSF & BCL
Assets
Structure of banking assets
(total in EUR billion and asset components in %)
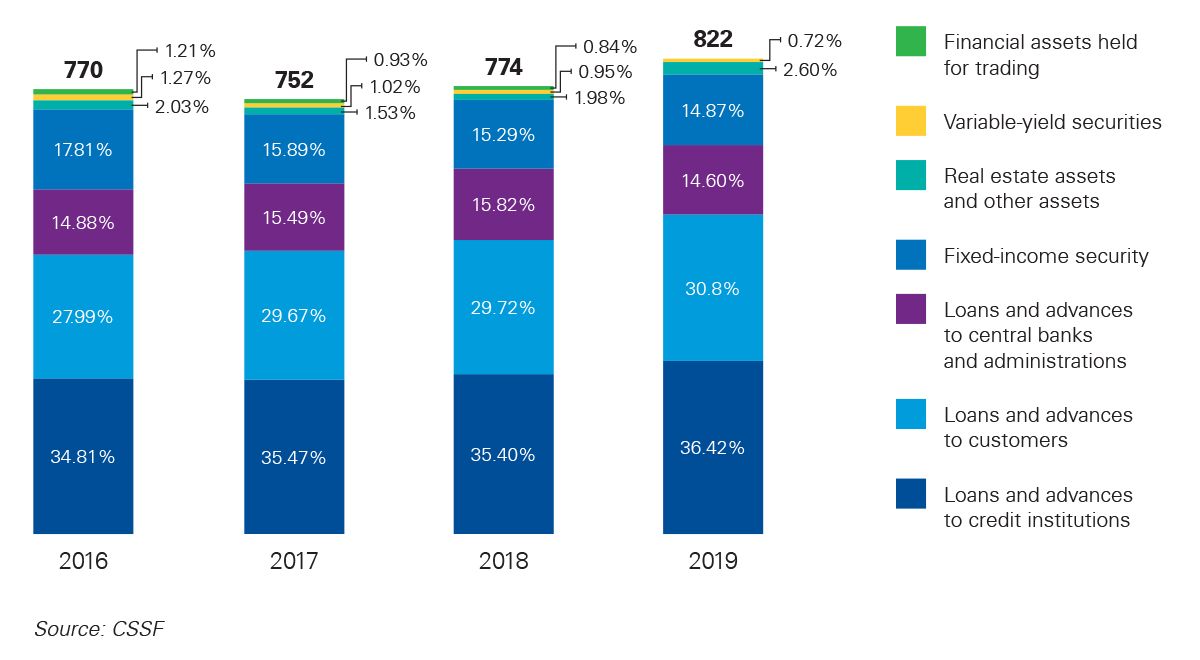
The breakdown of assets has remained quite stable in the last four years, while the total amount of banking assets increased by 6% between 2018 and 2019, reaching EUR822 billion.
Liabilities
Structure of banking liabilities
(total in EUR billion and liabilities components in %)
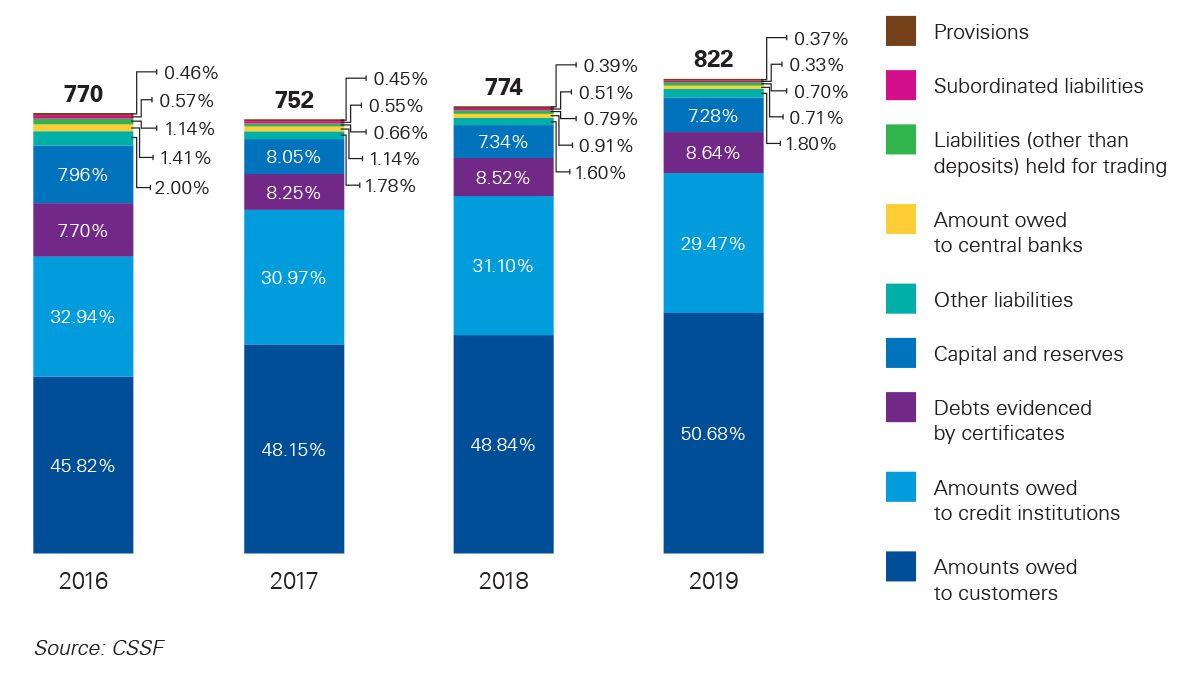
Deposits from credit institutions and customers remain the two main sources of funding for the Luxembourg banking market. Deposits from customers accounted for just over 50% of liabilities in 2019: their peak in the last four years. 21% of deposits from customers came from private customers and 79% from corporate customers in 2019*.
Banking performance
2019 banking income and expenses
Income trend (total in EUR billion and components in %)
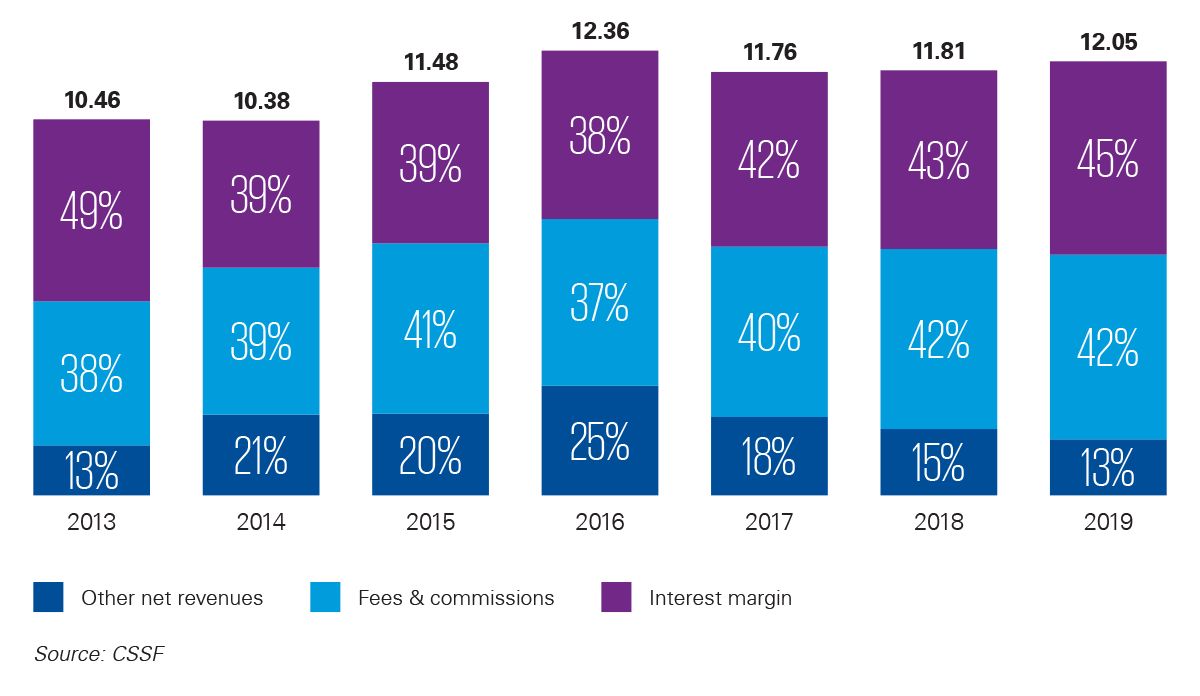
Total banking income increased slightly in 2019. The increase in the interest margin (+7.7%) was related not only to the increase in volume of activities but also to an improvement in the average rate of return on assets. In addition, more than half of the banks now apply negative interest rates on deposits from customers, especially institutional clients. Commission income has increased by 25% over the last five years and in 2019 reached EUR5 billion for the first time, due to the growth of investment fund business in Luxembourg and the evolution of the stock markets.
Expenses trend (total in EUR billion and components in %)
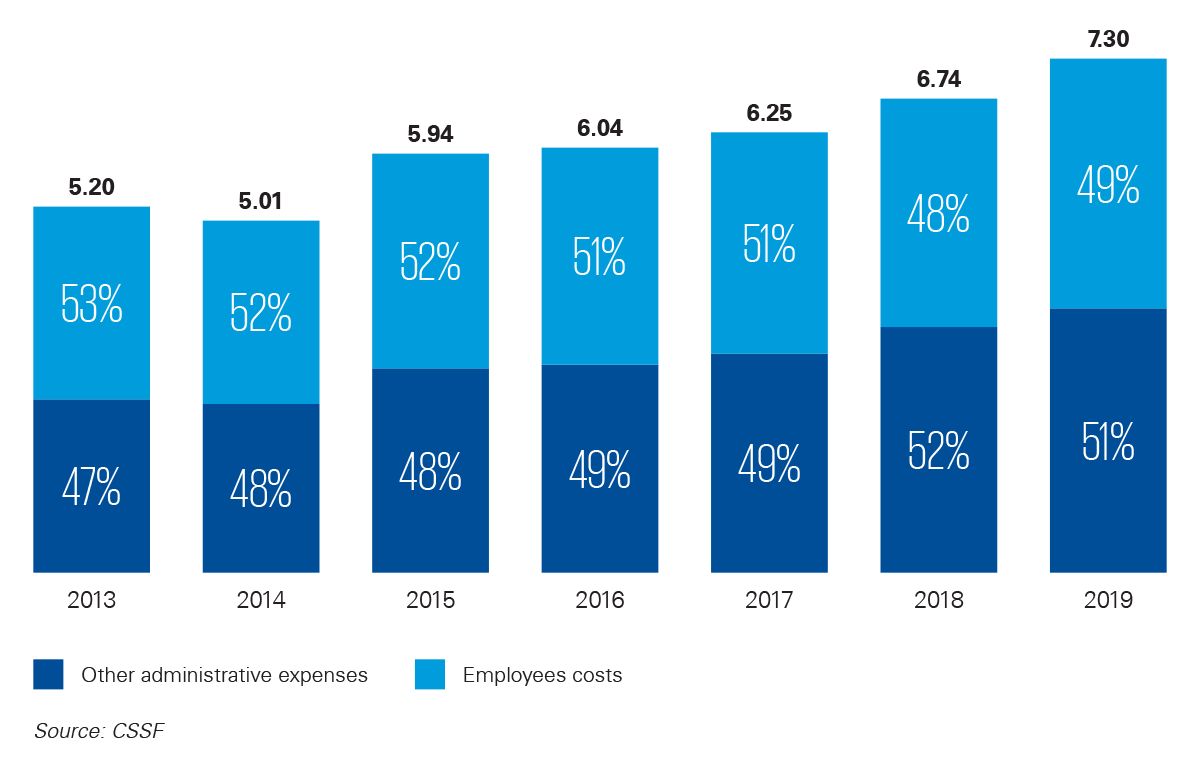
Total expenses have trended continuously upwards over the last five years. While the number of employees was quite stable during this time, employee costs increased by nearly EUR1 billion. This increase was mainly related to the wage indexation mechanism and to the composition of the workforce tending toward more highly qualified profiles. Similarly, for other administrative expenses, while the number of banks has decreased over the last five years, other administrative expenses rose by more than EUR1.4 billion due to significant investments in infrastructure, restructuring and regulatory compliance. The banking performance indicators section of this report gives a more detailed breakdown of how and why total operating costs have changed for each respective category of banks.
Area of origin of credit institutions in Luxembourg
Origin of financial institutions in Luxembourg
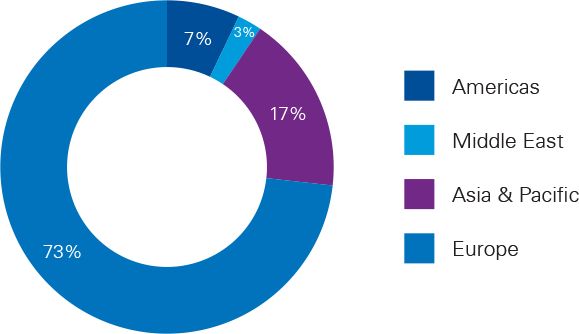
Source: CSSF
Countries of origin: Europe
Below are the numbers and geographical origins of financial institutions from European countries.
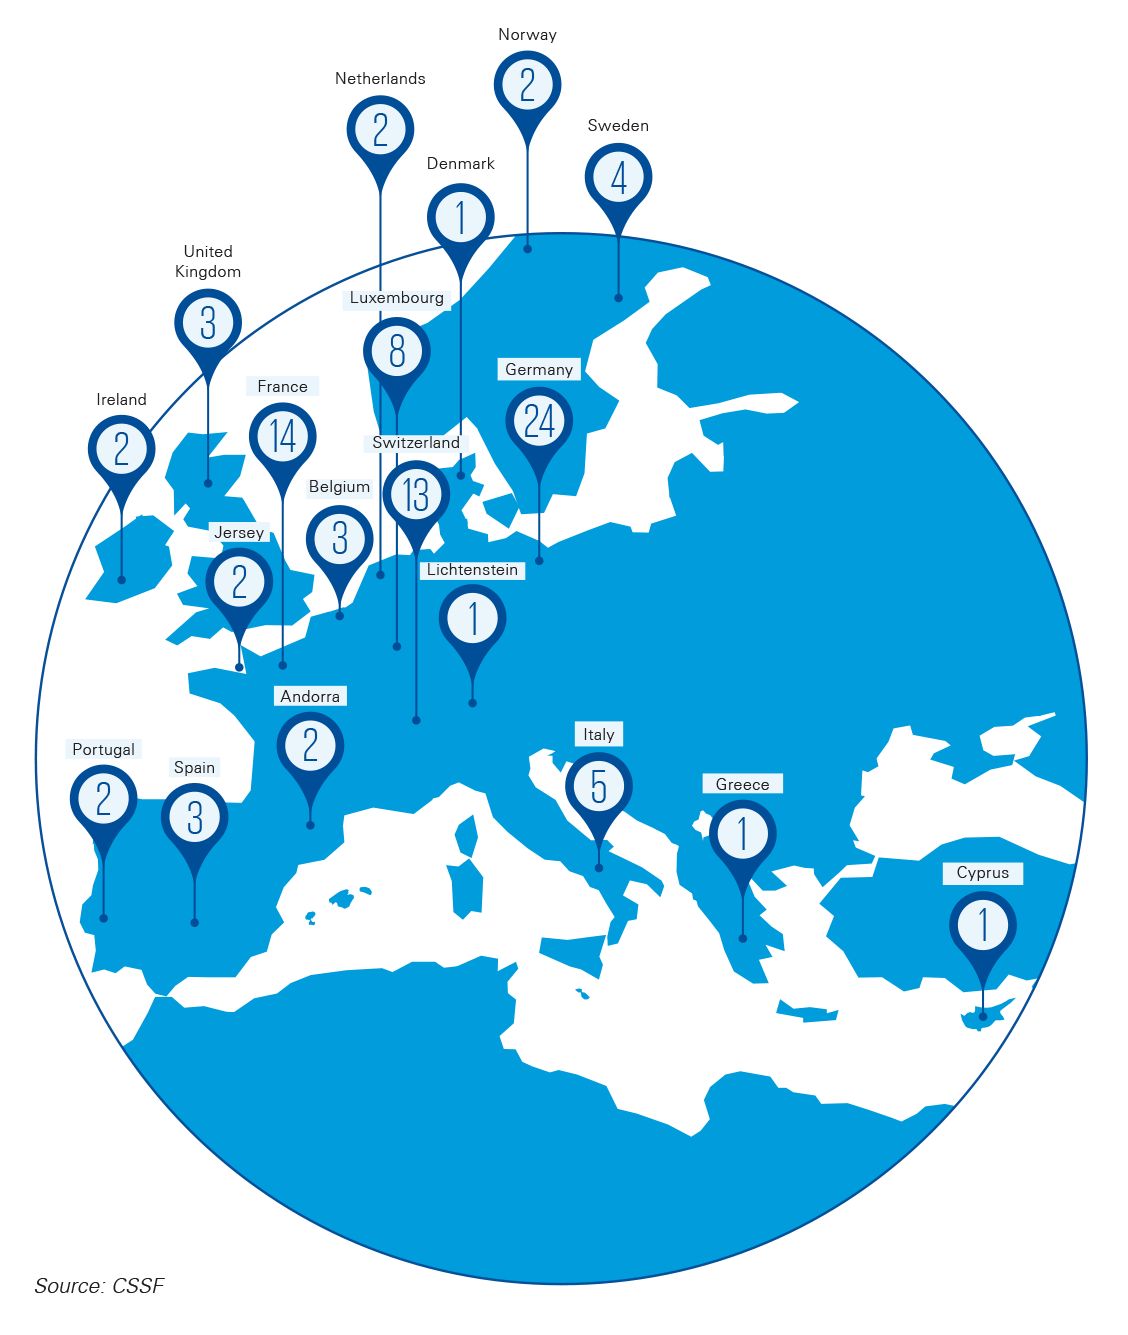
Among banks in Luxembourg, 93 are from Europe, and 44% of these are from Luxembourg’s three bordering countries
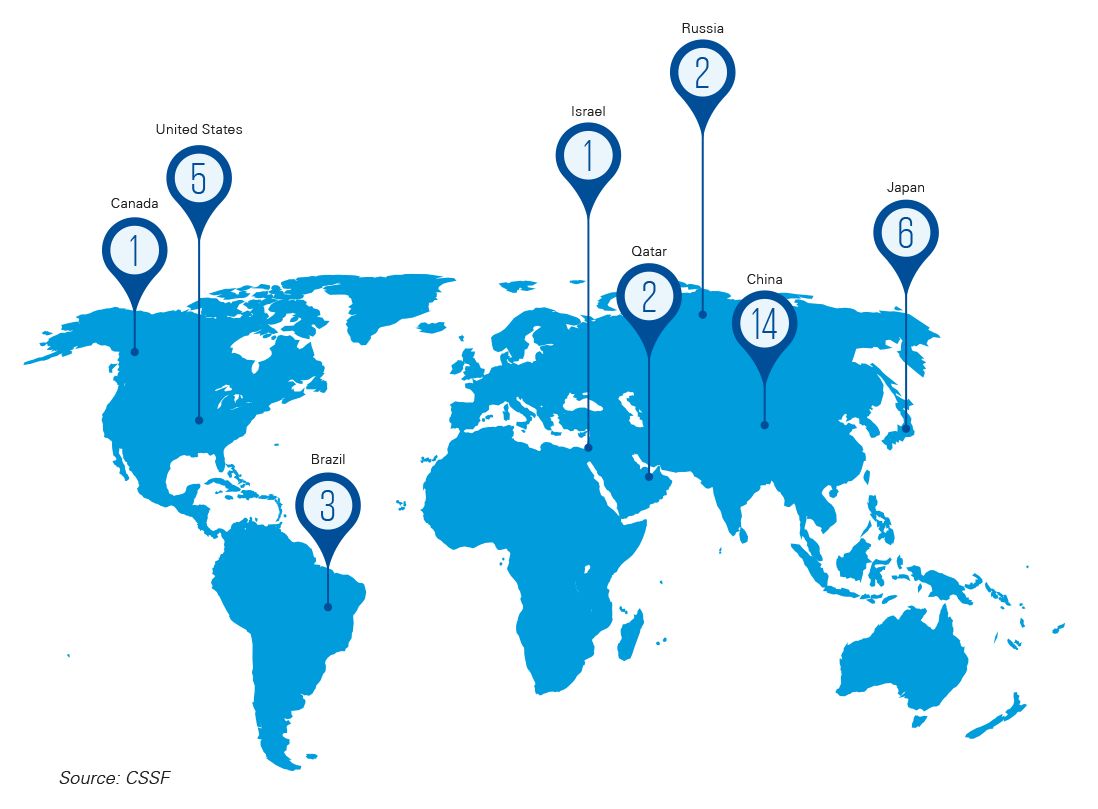
Countries of origin: worldwide
Below are the numbers and geographical origins of financial institutions from non-European countries.
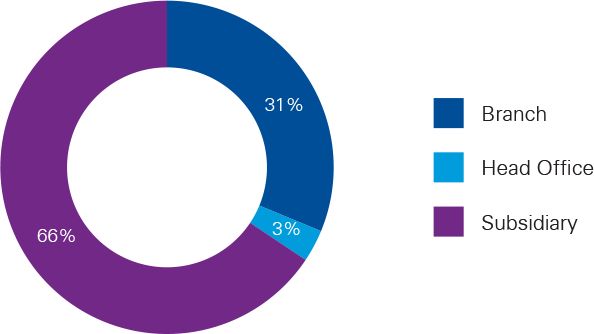
EU segmentation of legal entities in Luxembourg
Source: CSSF
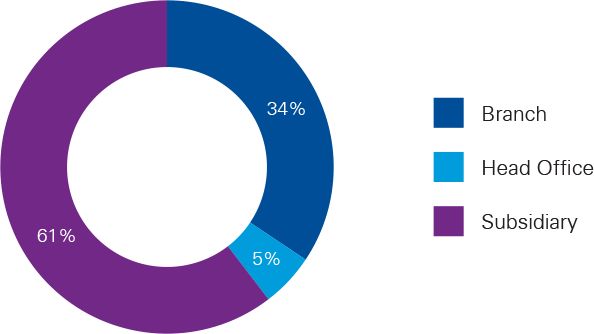
Non-EU segmentation of legal entities in Luxembourg
Source: CSSF
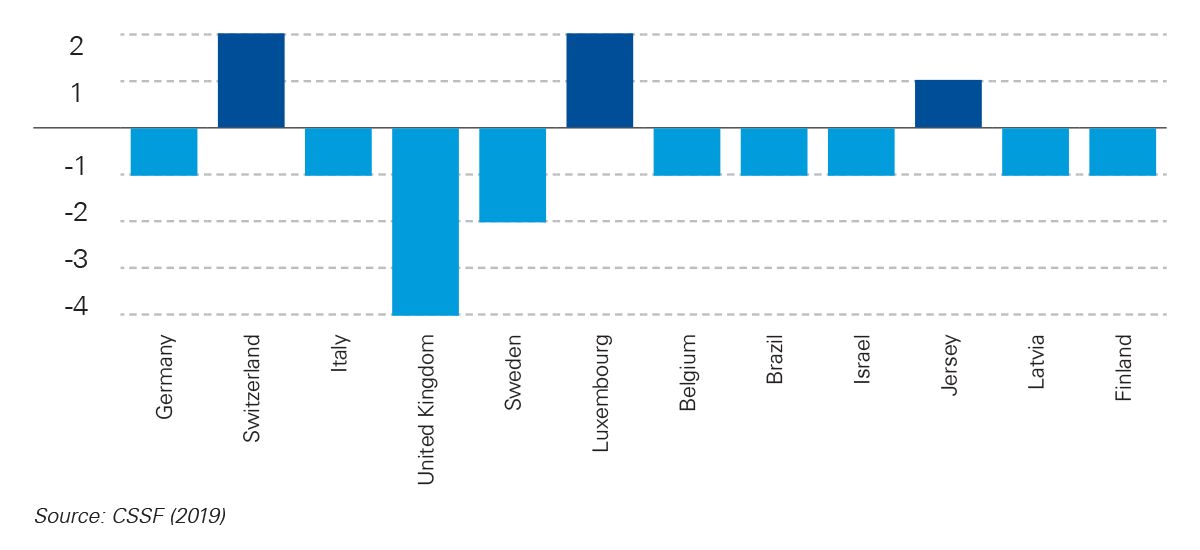
New entries and leavers in Luxembourg in 2019

Number of credit institutions