
Banking performance indicators
Luxembourg banking insights 2020
Benchmark your bank by deep-diving into balance sheet and P&L components, together with performance indicators, segmented by bank type.
In collaboration with
Banking industry segmentation
Our study is based on 85 banks located in Luxembourg, covering 70% of the total amount of assets in the market. We have divided these banks into four different segments based on their business type:
- Universal banks that provide a combination of the services offered by the three banking segments described below
- Depositary banks that focus on custody services for their own groups and institutional clients around the world
- Private banks that manage the personal finance of high net worth individuals (HNWIs) by providing a wide range of financial services
- Commercial banks that focus on deposits, business loans, payments and basic investment products.
Three banks specialized in issuing covered bonds were not included in the four segments given their specific business area. Branches are excluded from the analysis.
Breakdown by business type
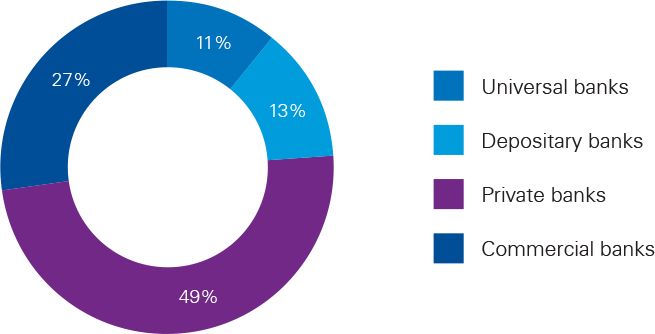
Source: KPMG study
Through this annual analysis of the Luxembourg banking market we focus on performance indicators that reflect the overall trends observed per banking segment.
We gathered financial data as at end December 2019 from the banks’ annual accounts, which had been drafted using LuxGAAP methodology in 70% of the cases and IFRS in the remaining 30%. (N.B. The adoption of IFRS is increasing, given that this figure was 25% the previous year.) The two methodologies imply different account measurement types and a diverse level of granularity in the notes section. However, we have standardized all indicators for both accounting schemes to provide accurate and consistent results.
Regulatory classification* of the 85 banks included in our analysis
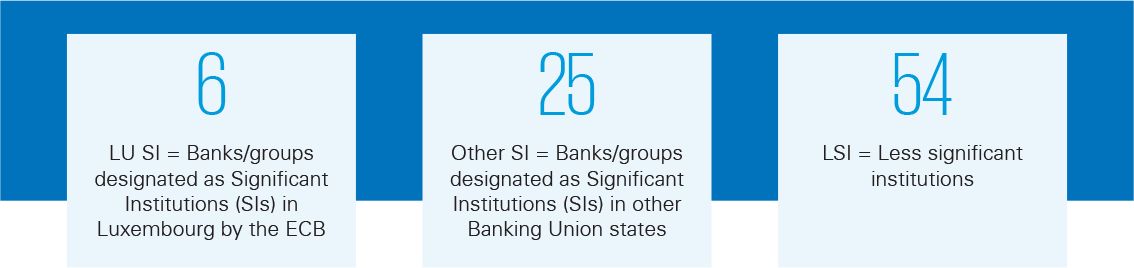
* ECB List of supervised entities (PDF, 945KB)
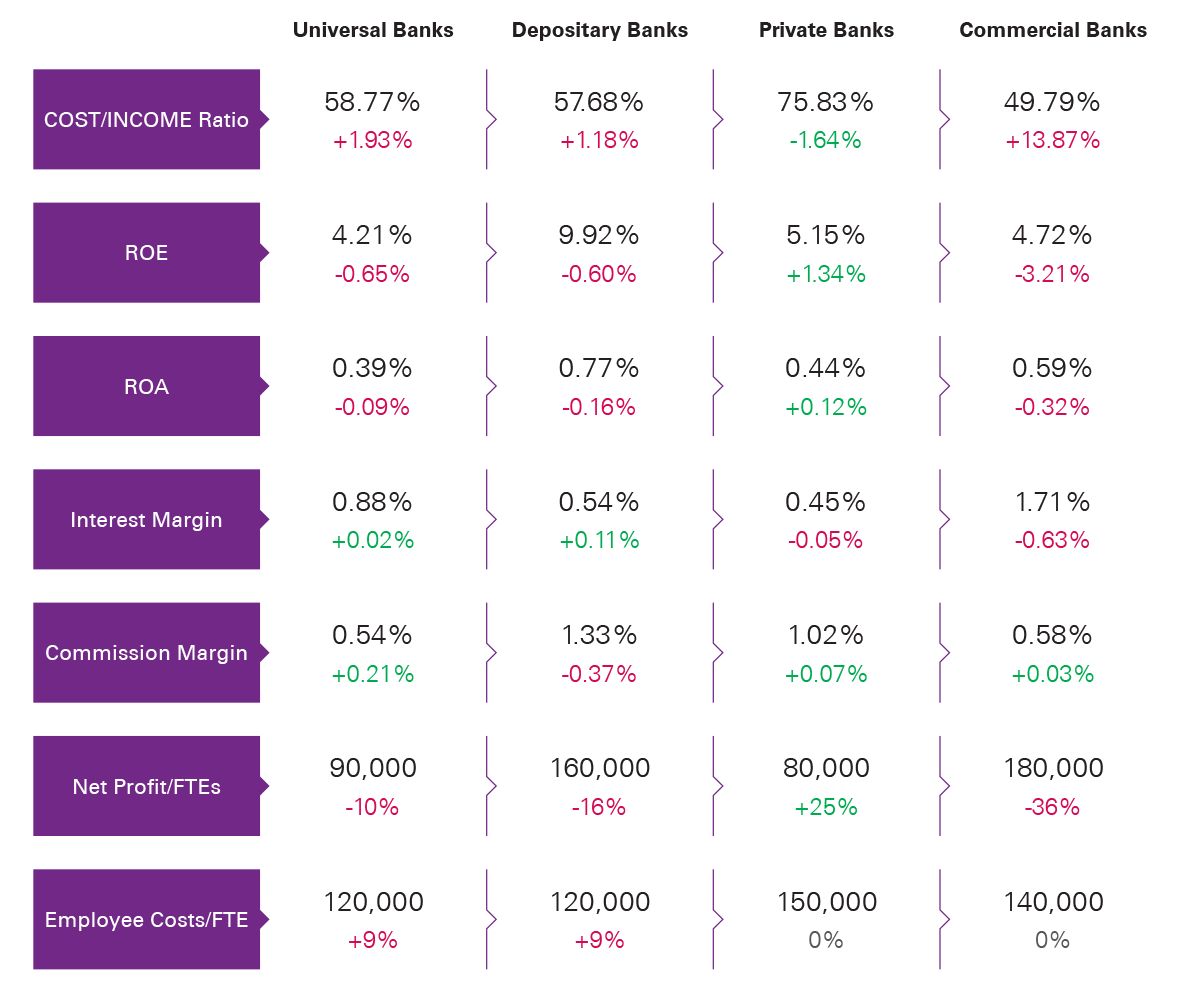
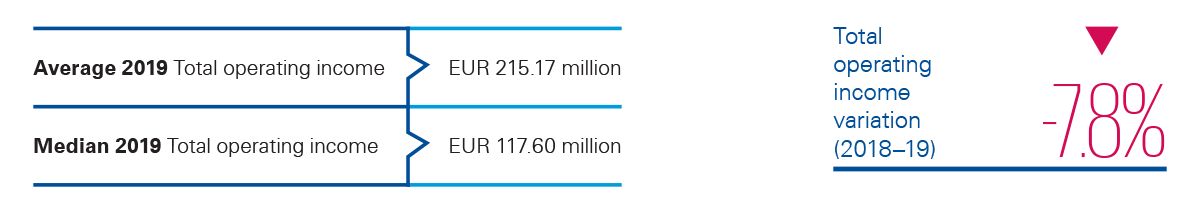
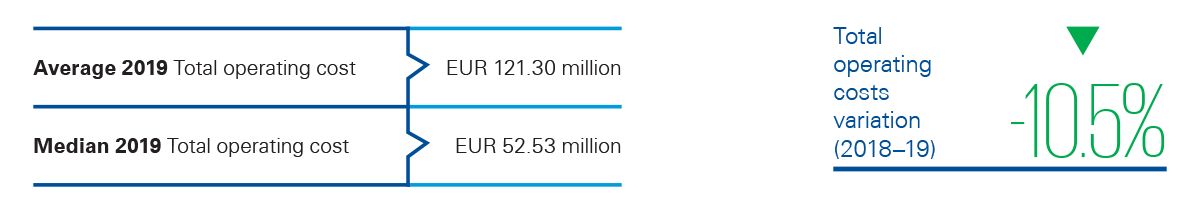
Key performance indicators
A selection of key performance indicators
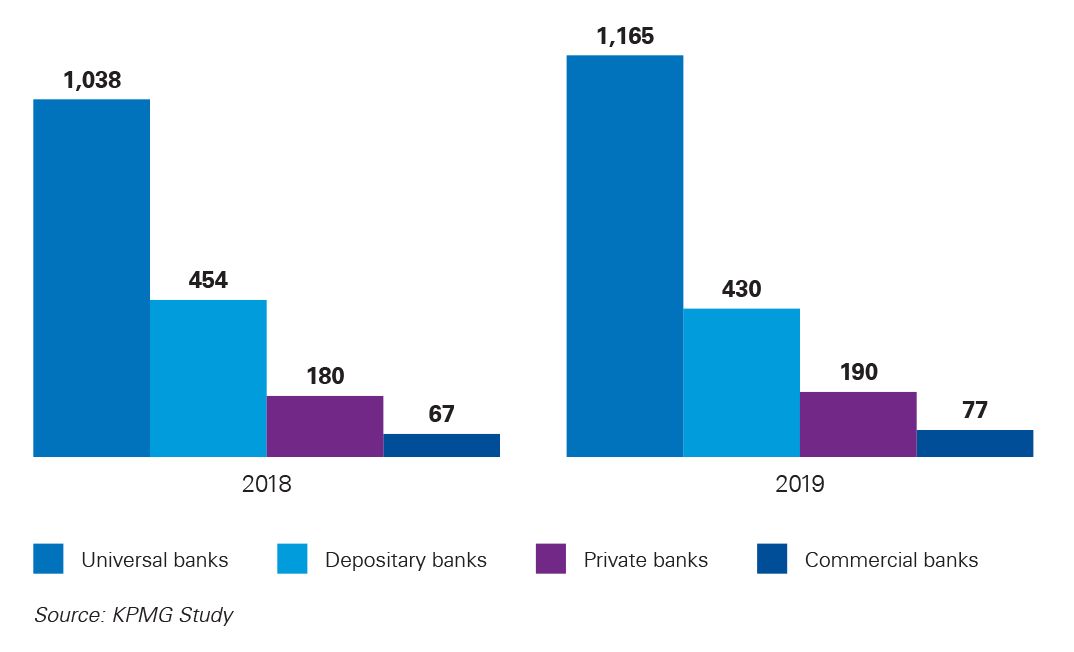
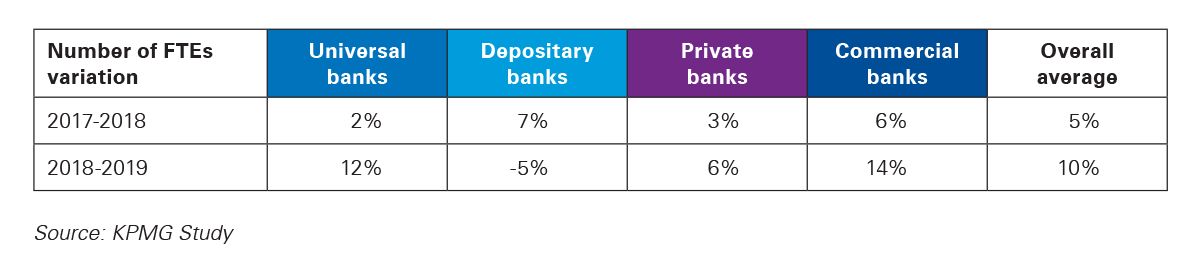
Average number of employees per banking segment
Benchmark your bank
Use the buttons below to view balance sheet and P&L components together with performance indicators by bank type.
Universal banks
Profit and loss overview
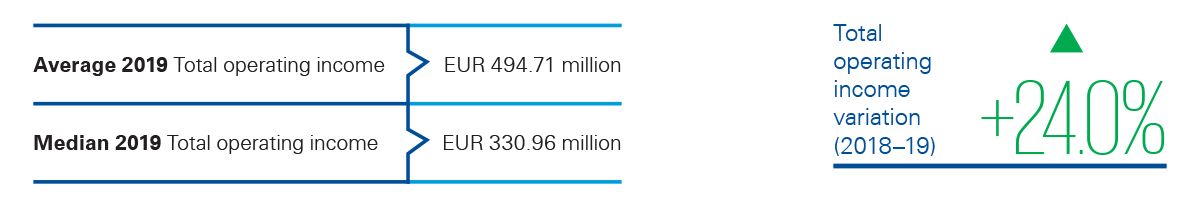
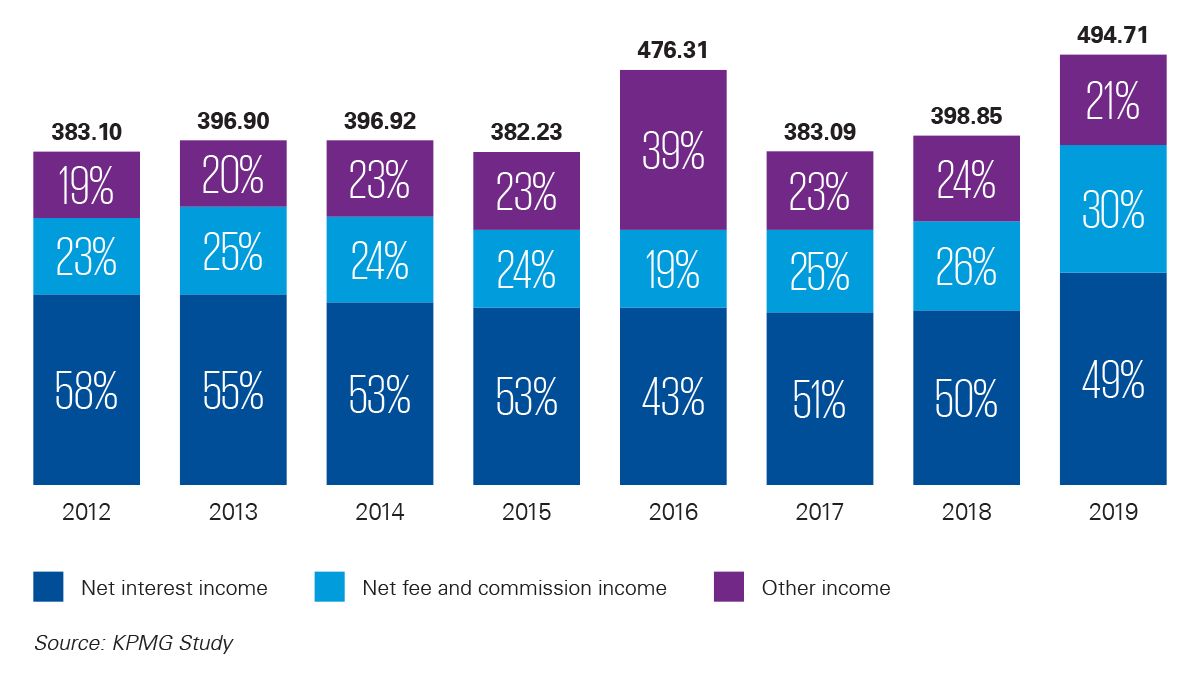
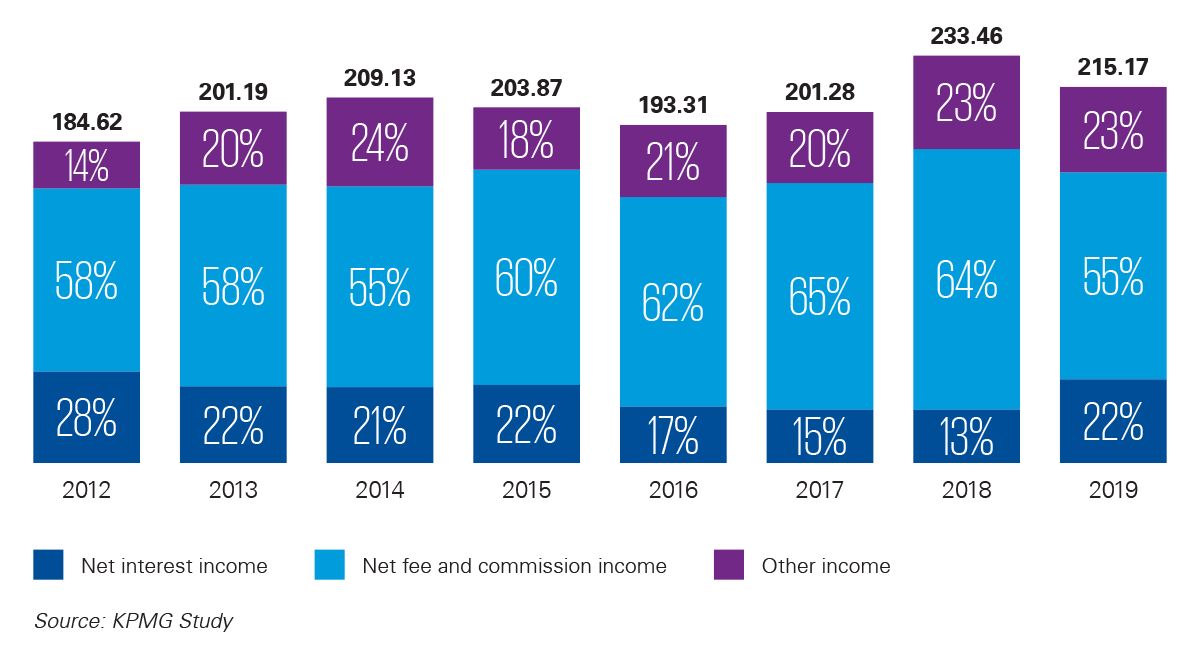
Total operating income (average in EUR million)
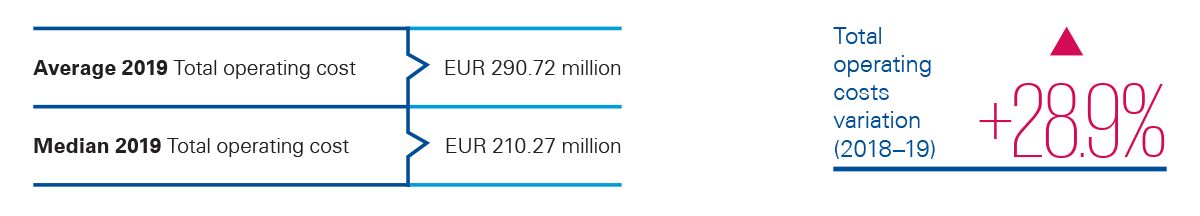
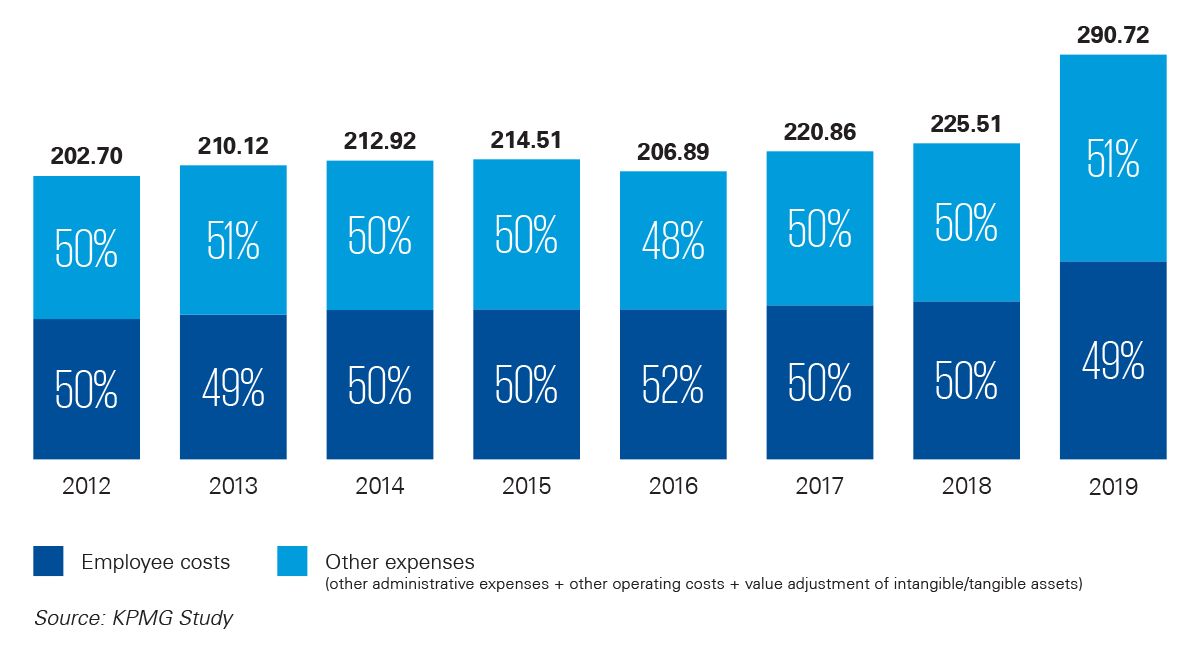
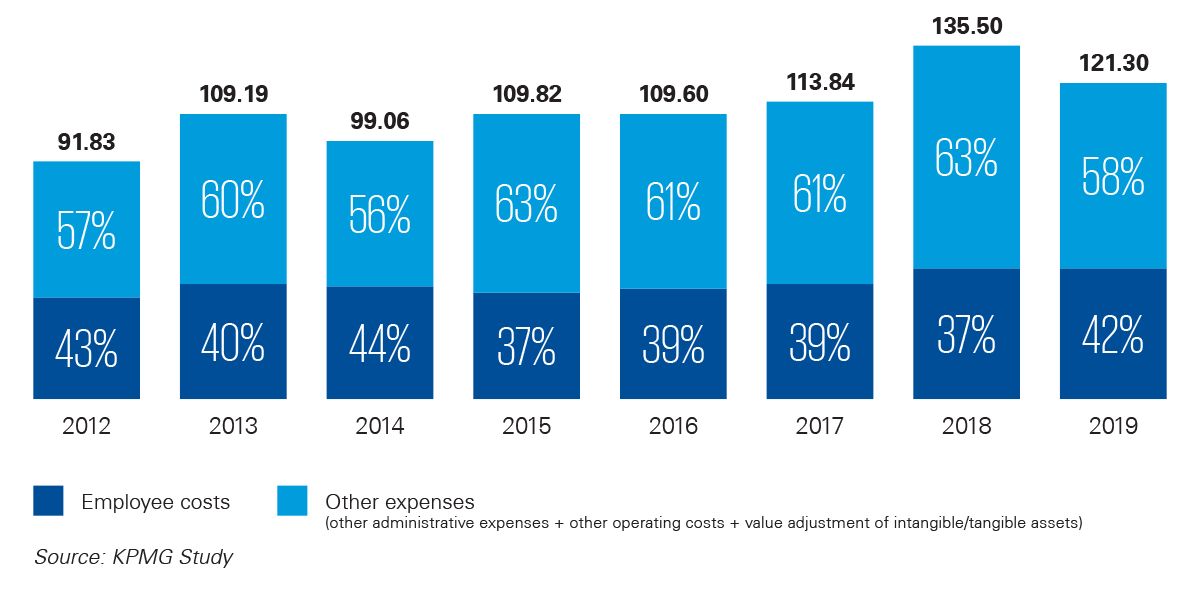
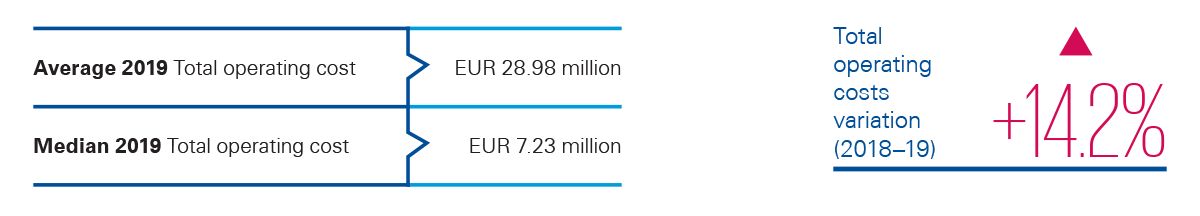
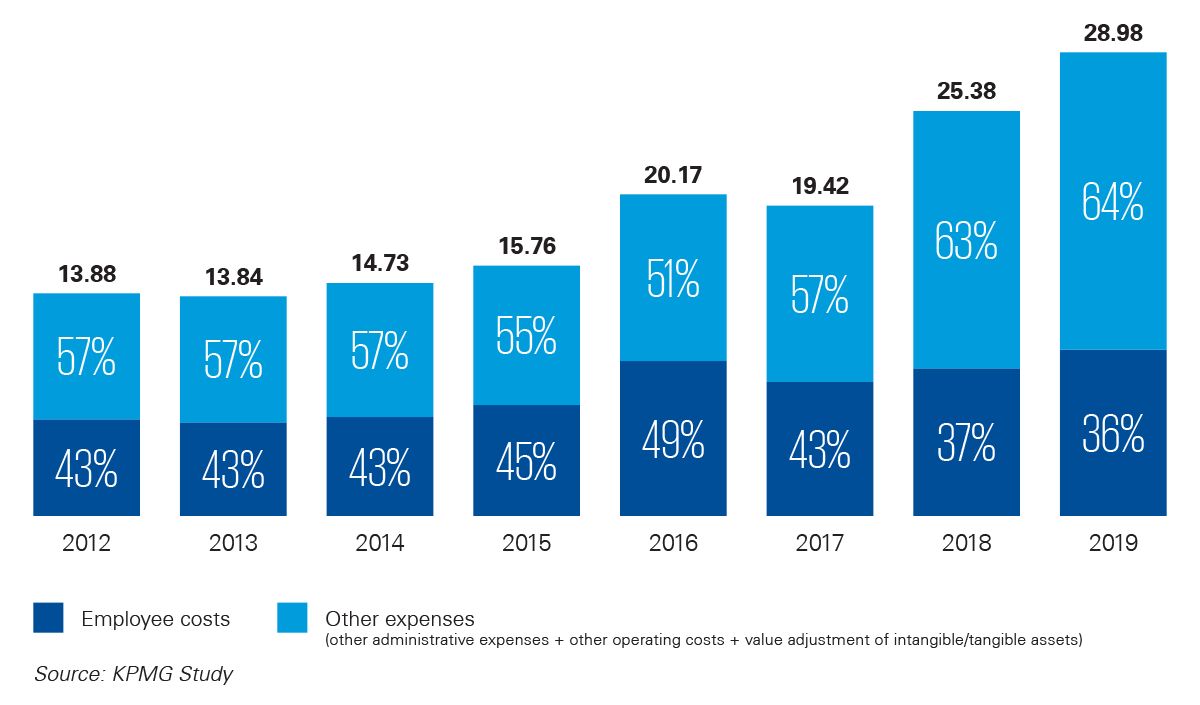
Total operating costs (average in EUR million)
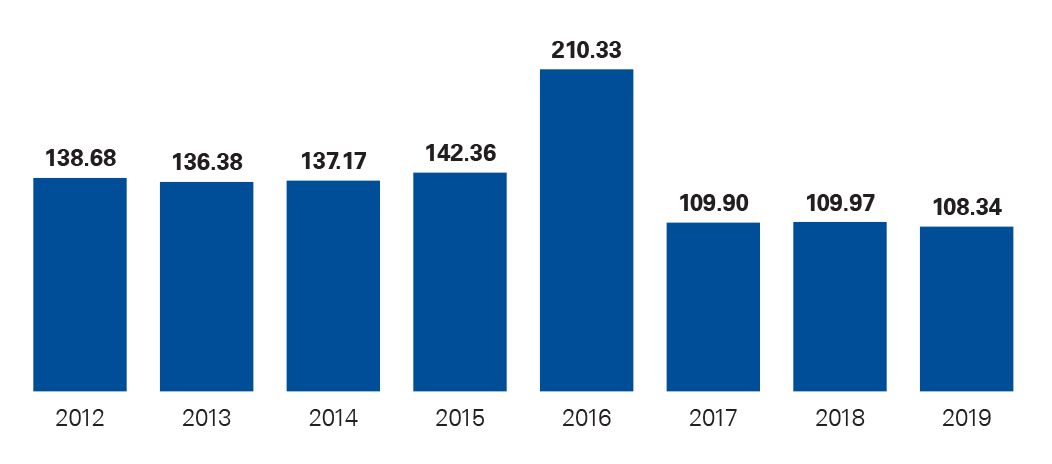
Net profit (average in EUR million)
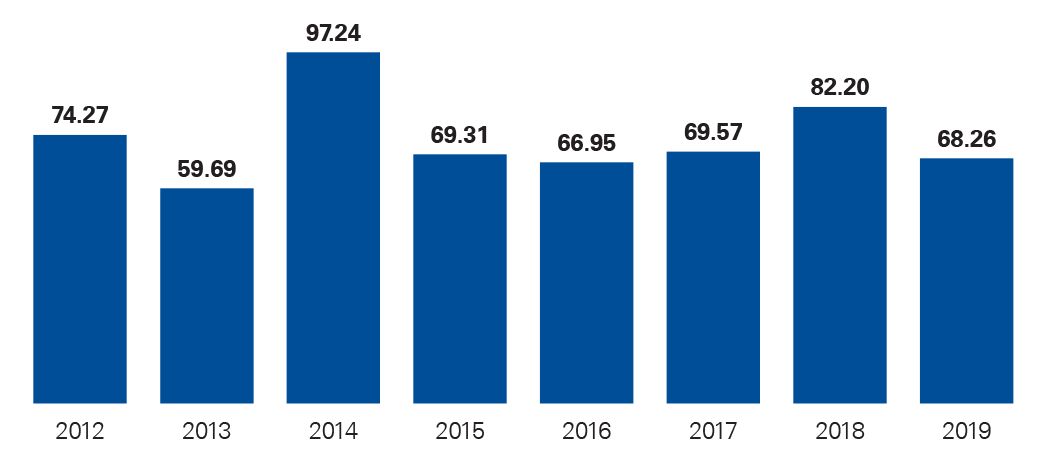
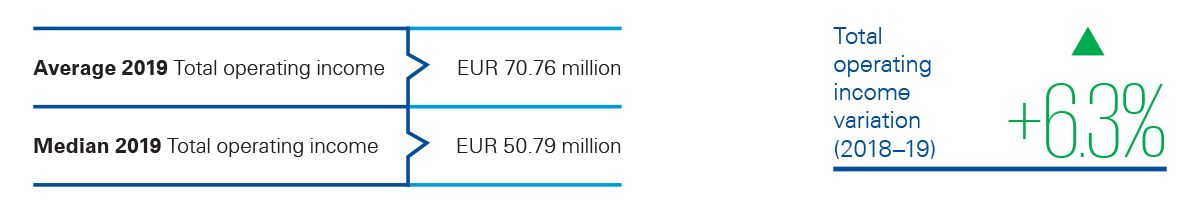
Average total operating income and total operating costs increased significantly for universal banks in 2019, mainly due to the reclassification of one former depositary bank as a universal bank. Additionally, this bank expanded the scope of its activities to further develop its business in the EEA, in direct response to the UK’s decision to leave the EU. As a consequence, the bank registered a significant increase in both total operating income and total operating costs compared to all previous years.
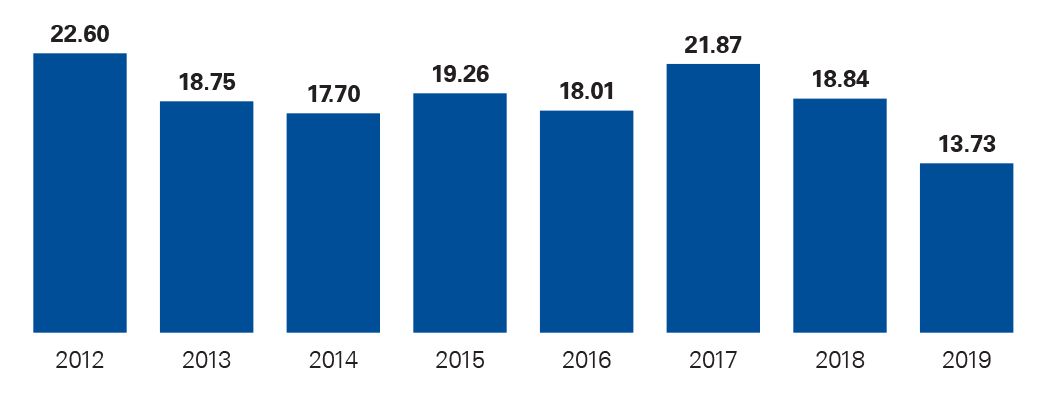
Except for 2016, when a one-time transaction at a universal bank skewed the figures, net profit has shown a stable trend in recent years.
Balance sheet overview
Balance sheet (in EUR billion)
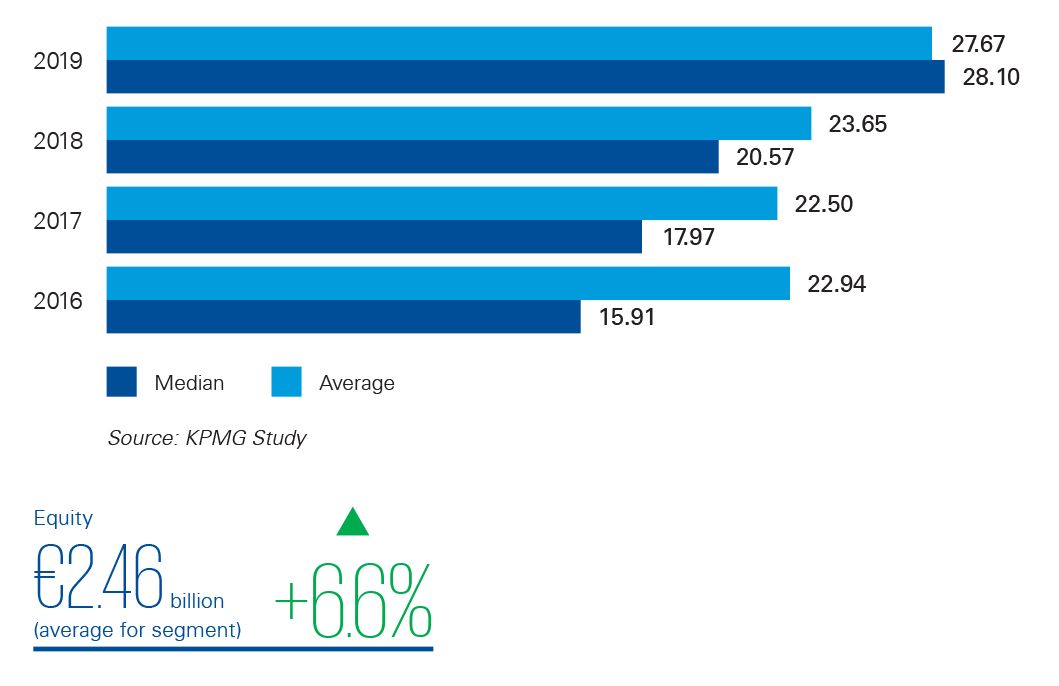
Average balance sheet assets grew by 17% in 2019 due to the additional assets brought in by the “new” universal bank, leading to an upward trend in this measure for a second consecutive year.
Loan-to-deposit (customer) ratio
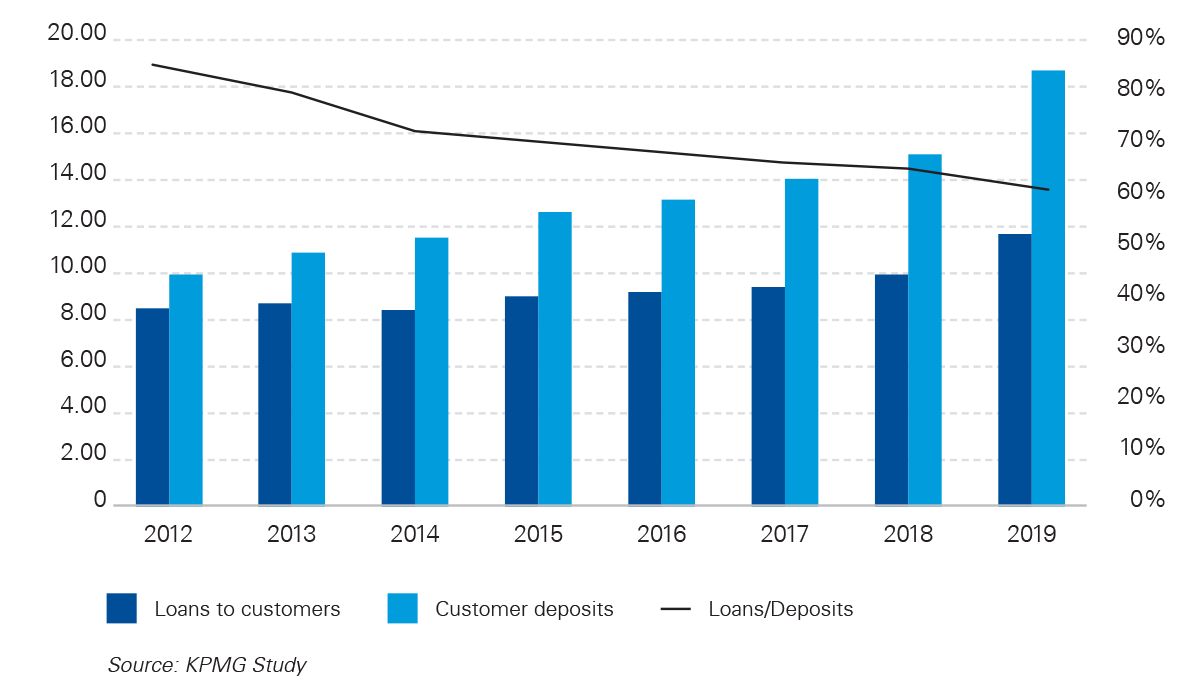
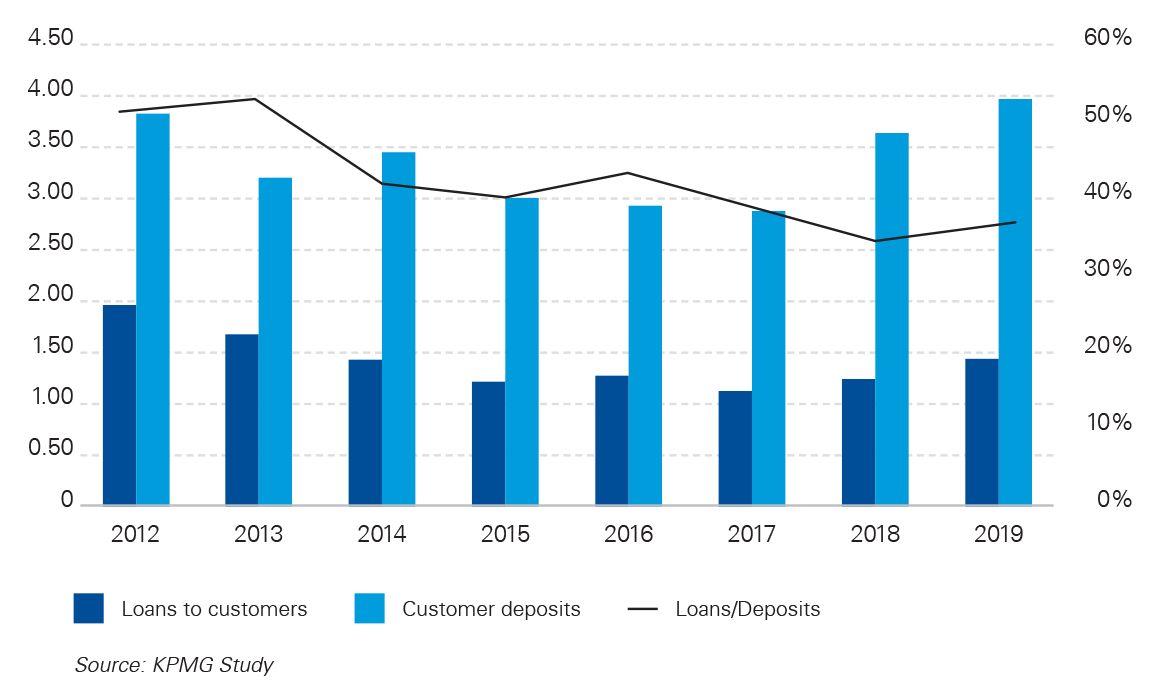
Loans to customers and the amounts owed to customers (customer deposits) increased in 2019 because of the new entry in the universal banks category mentioned above. However, this had no significant impact on the loan-to-deposit ratio.
Depository banks
Profit and loss overview
Total operating income (average in EUR million)
Total operating costs (average in EUR million)
In 2019, the depositary bank segment was subject to two major changes: one bank became a branch of another European bank, while another credit institution was reclassified as a universal bank.
The exclusion of the results of the former bank caused a decrease in average total operating income and total operating costs for 2019. On the other hand, the reclassification of the former depositary bank as a universal bank did not have an impact on the overall trend, but did cause a decrease in the average amount of total operating income and total operating costs over the previous seven years.
Net profit (average in EUR million)
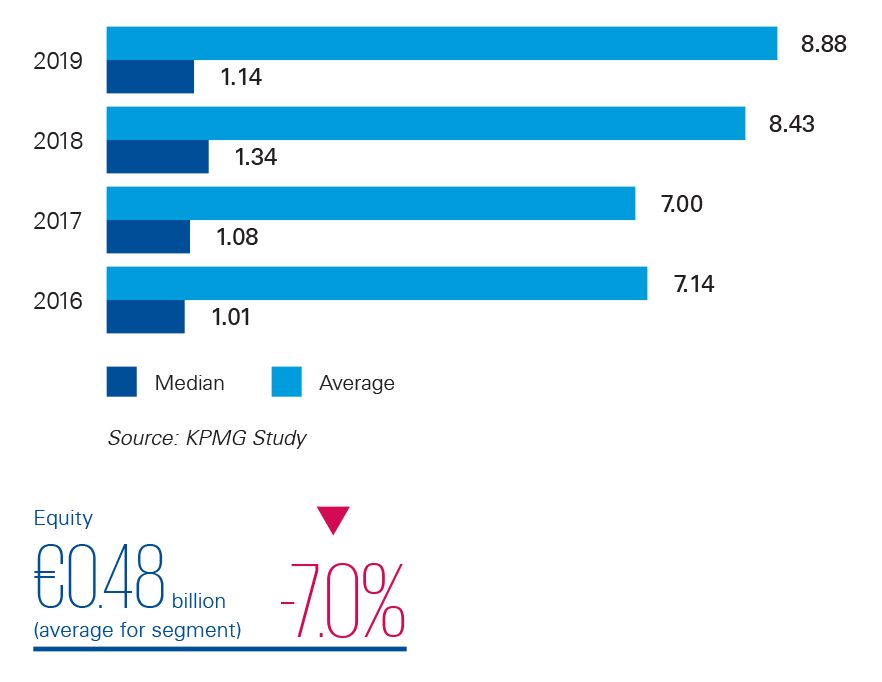
Depositary banks’ average net profit decreased by 17% since last year. This negative variation was due partly to the exclusion from the 2019 analysis of the bank that became a branch of another European bank, and partly to the strong decrease in “other income” of another depositary bank as a result of significantly reduced dividend income.
Balance sheet overview
Balance sheet (in EUR billion)
The average balance sheet amount has grown by 24% since 2016.
Loan-to-deposit (customer) ratio
The loan-to-deposit ratio increased slightly in 2019, against the negative trend of the previous two years.
Private banks
Profit and loss overview
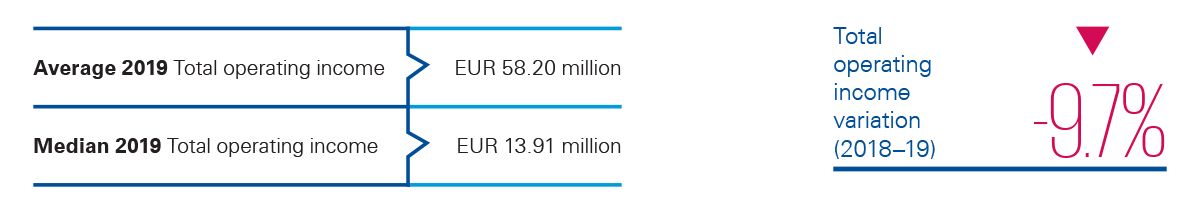
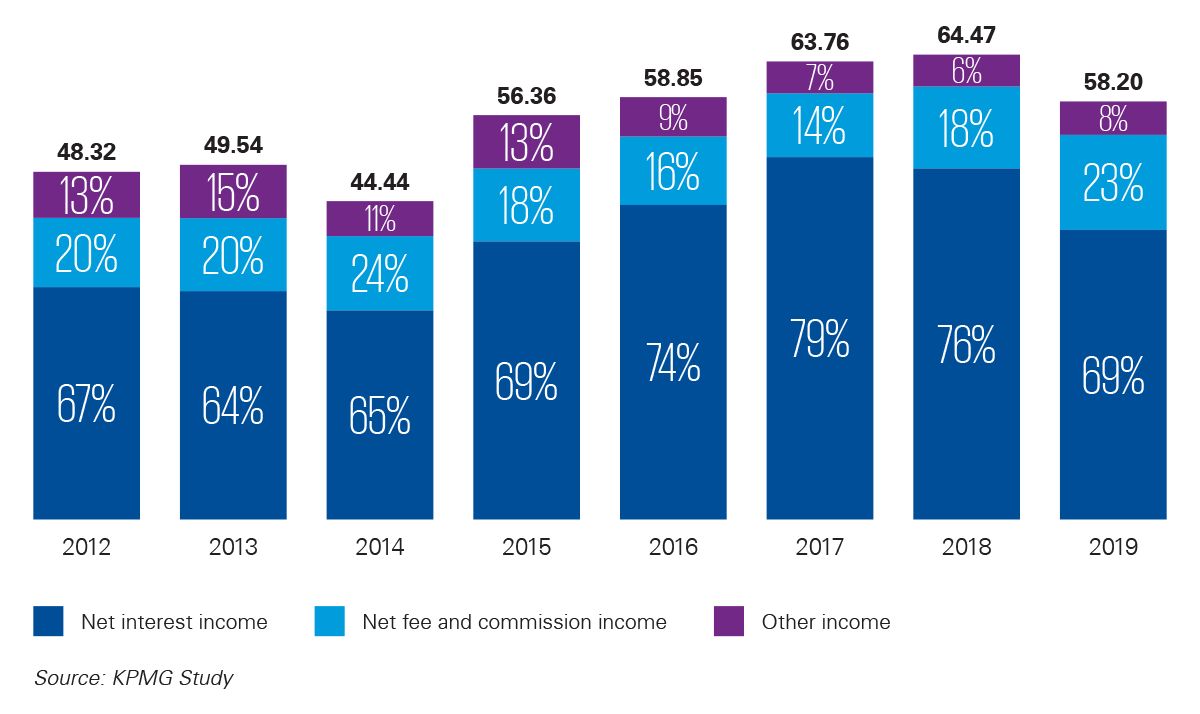
Total operating income (average in EUR million)
Total operating costs (average in EUR million)
Net profit (average in EUR million)
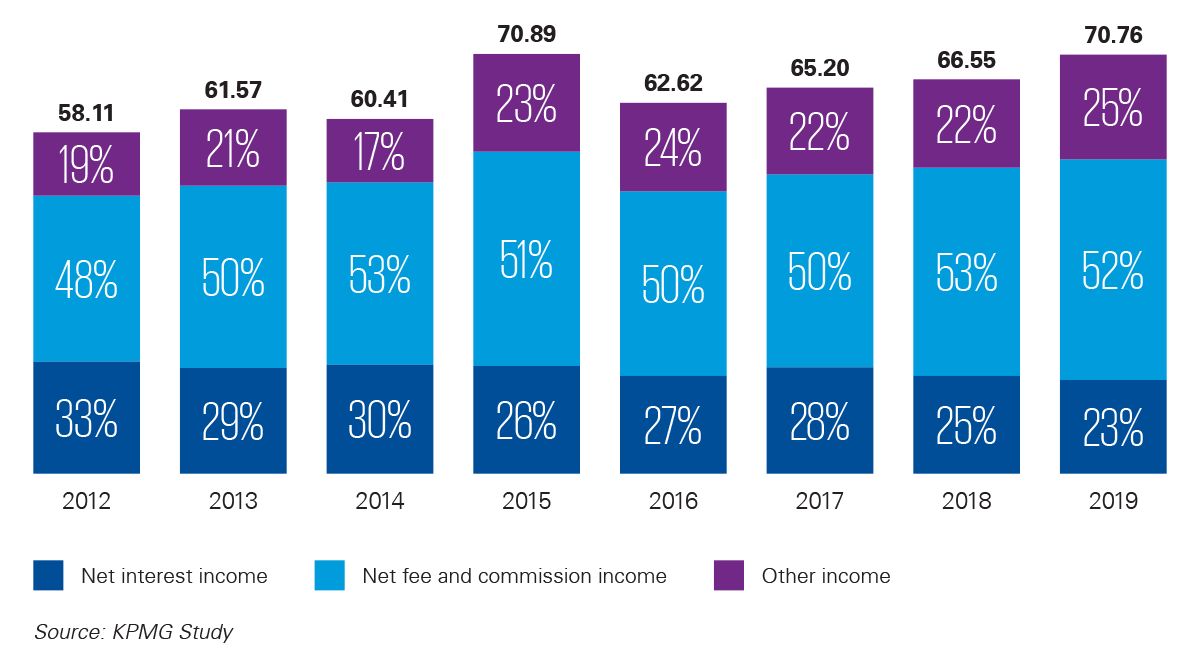
The average operating income of private banks grew by 6.32% compared to 2018, a rise that was fairly homogeneous across the sector. This growth was mainly due to increasing AuM (which have increased by 76% since 2008, to reach EUR395 billion in 2018). The importance of commission income is evidenced by the fact that the relative share of interest income has been on the decline for several years, and amounted to only 23% in 2019, compared to 25% the previous year.
Regulatory projects (e.g. AML and MiFID) and fierce competition between banks regarding client relationship managers led to a similar increase in average operating costs.
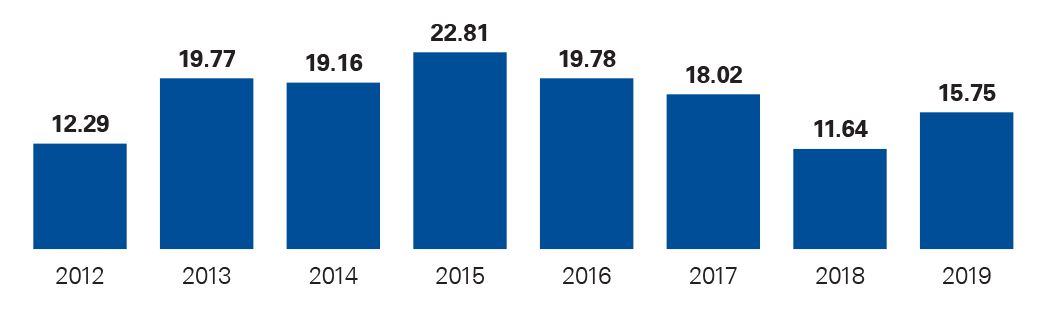
After three years of decline, net profit increased by 35% in 2019 thanks to a one-time transaction not shown in operating income.
Balance sheet overview
Balance sheet (in EUR billion)
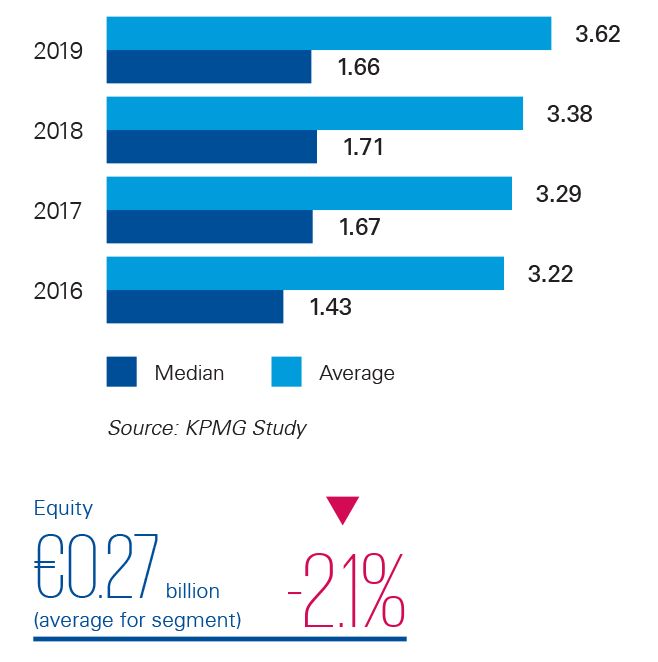
The average balance sheet amount increased by 7% in 2019.
Loan-to-deposit (customer) ratio
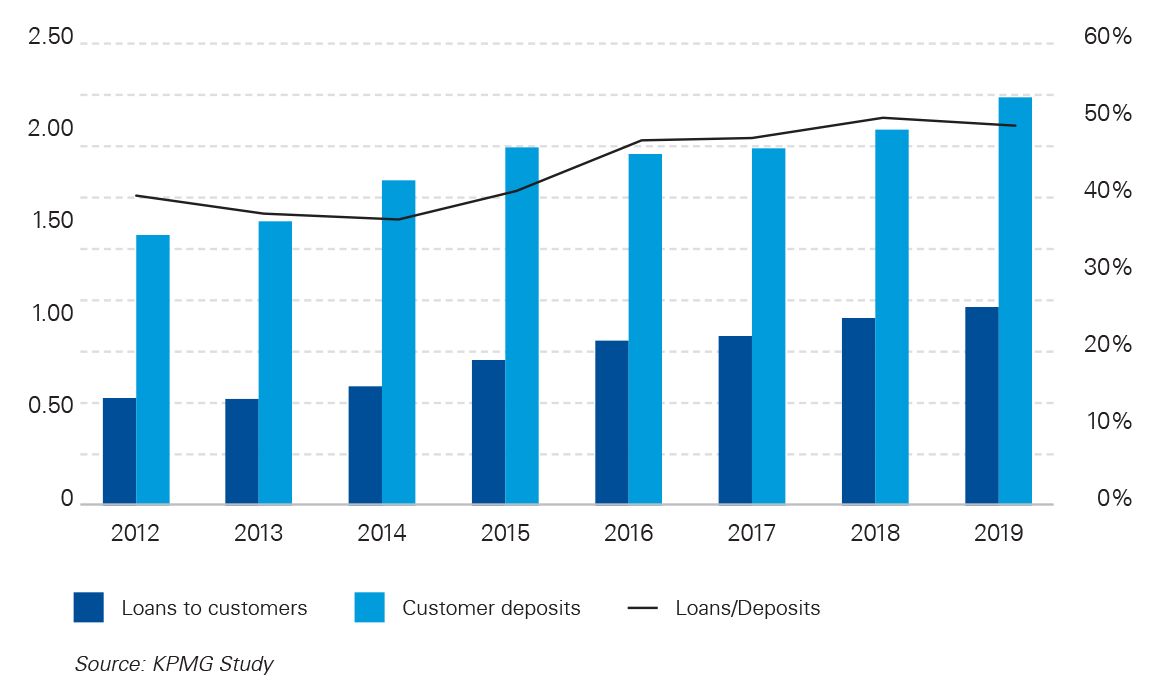
The loan-to-deposit ratio decreased slightly in 2019. Its value has been quite stable for the past four years.
Commercial banks
Profit and loss overview
Total operating income (average in EUR million)
Total operating costs (average in EUR million)
Net profit (average in EUR million)
Prior to 2019, the average total operating income at commercial banks had been on an upward trend for four years. Contrary to the banking market as a whole, this indicator decreased last year, because of a significant fall in the net interest income of one bank, resulting in a reduction of 27.1% in net profit for this segment in 2019.
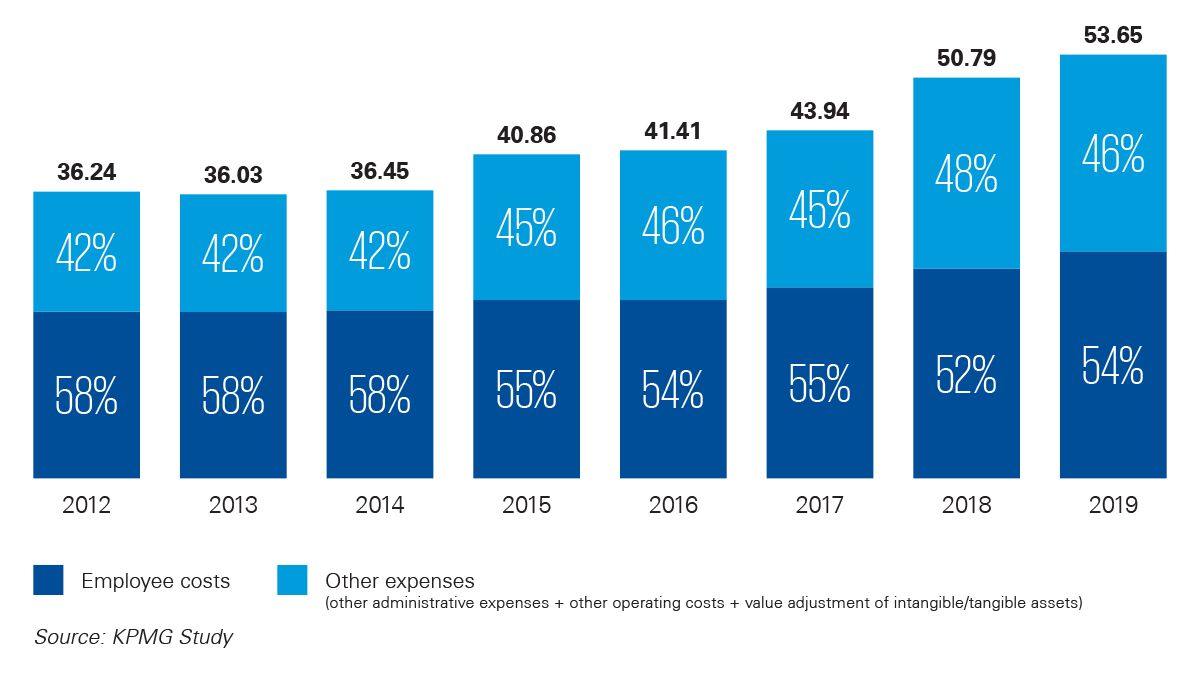
Average total operating costs have increased by 49.2% since 2017, mainly due to a significant rise in other operational expenses.
Balance sheet overview
Balance sheet (in EUR billion)
Loan-to-deposit (customer) ratio

The average balance sheet increased by 12.17% in 2019, while the customer loan-to-deposit ratio remained unchanged compared to the previous year.