
Interest income provides stability as AuM and NNM decline
Swiss private banks remain dependent on movements in financial markets. As AuM returned to the level seen at the end of 2020, and NNM was much weaker following a record 2021, banks are struggling to secure either.
The industry's performance was stable overall, however, thanks to a boost in interest income compensating for declines in commission income.
Section information We analyzed the Swiss private banking industry as a whole, based on our sample of 73 private banks. The industry financial statements presented are the aggregate of the 73 banks’ financial statements. It should be noted that the Big 8 banks have the biggest weighting in these figures, representing 77% of the industry’s AuM. We also group the banks into four performance clusters based on their cost-income ratio, a key profitability metric. |
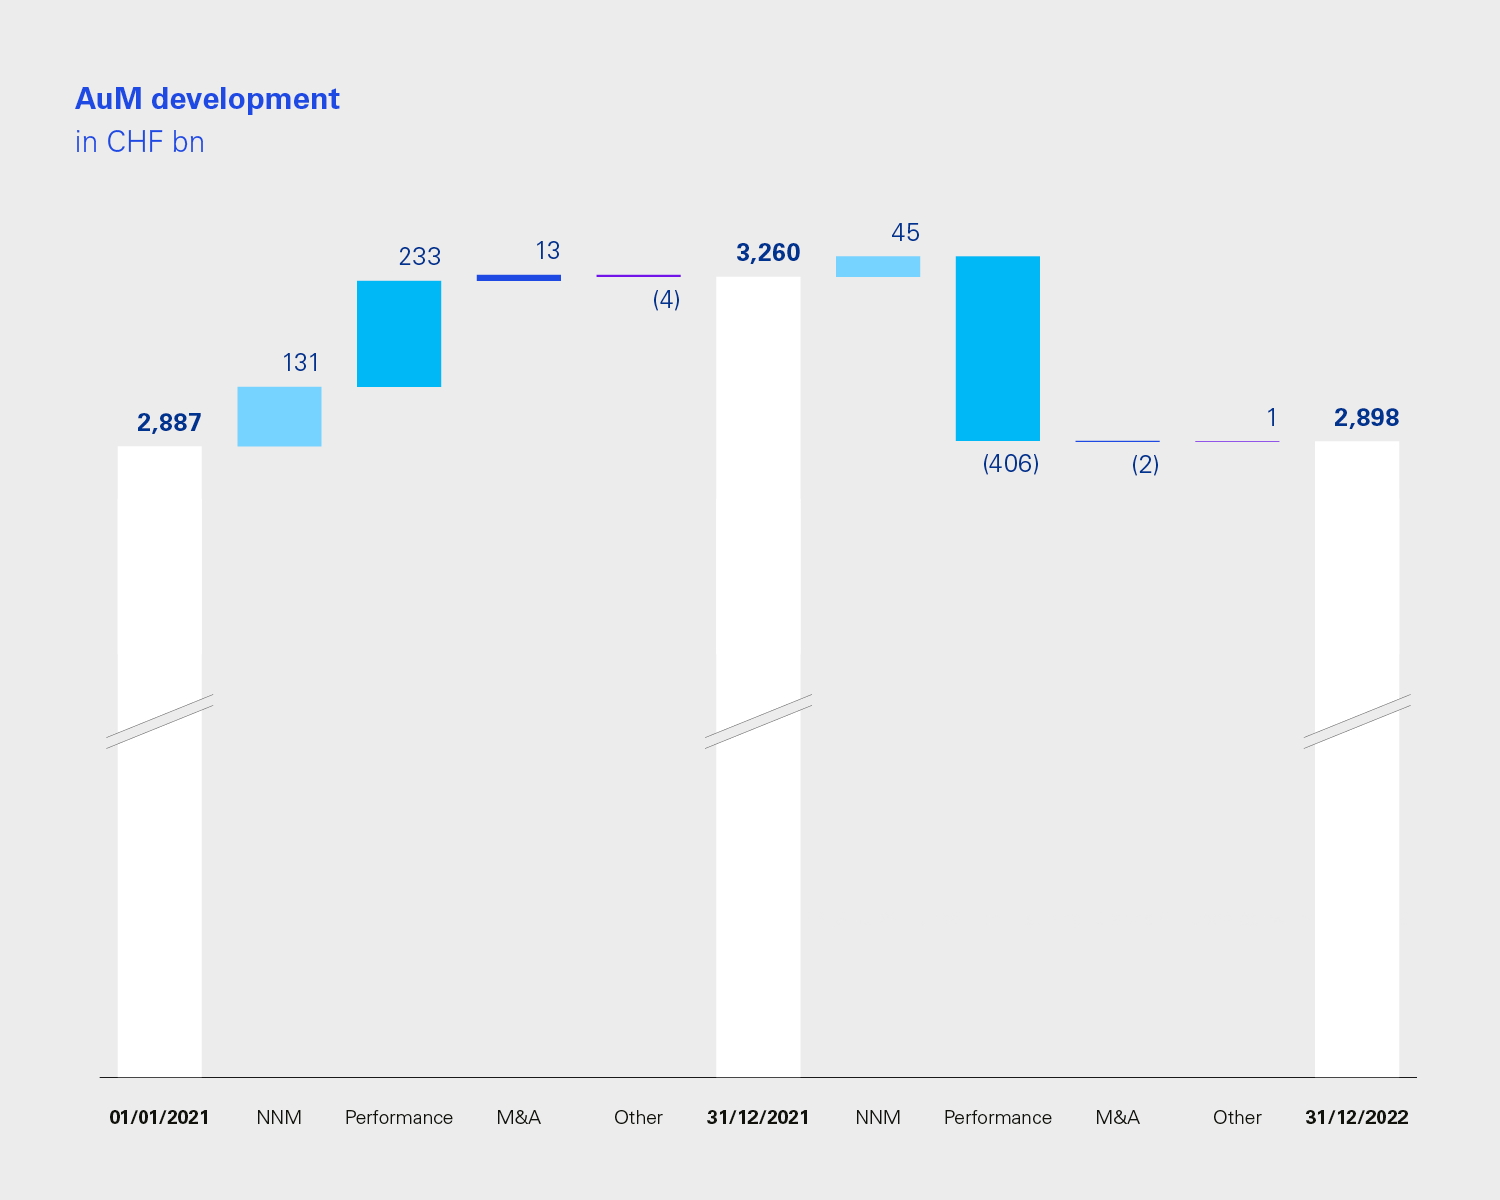
AuM development
1 January 2020 – 31 December 2023 (in CHF bn)
> Click on the image to enlarge it
AuM back to the level of 2020
Extremely challenging financial markets drove the AuM of the 73 banks at the end of 2022 back to where they were in December 2020. Strong markets in 2021 had boosted AuM, but valuations of all asset classes fell in 2022, more than offsetting the previous gains.
Banks' dependency on financial market movements for AuM and commission income remains very high, as is evident in the chart.
While no major M&A deals were announced by the banks in our sample in the past two years, UBS's takeover of Credit Suisse will have a significant impact on Swiss private banking industry.
NNM was unable to compensate for negative market performance
After a strong 2021, NNM was much weaker in 2022, driven by 78% lower NNM at the Big 8 banks. It was nowhere near enough to compensate for market effects. Small banks were the only cluster able to maintain its level of NNM in 2022.
While the wealth of the rich continues to grow, many banks are struggling to convert this into a continuous flow of NNM and growth of their AuM base.
A strong M&A pipeline and NNM is still key to profitable growth and as a way of not being entirely dependent on market performance.
Swiss private banks do not appear to have benefited last year from Switzerland's role as a safe haven, nor from the turmoil at Credit Suisse. Did discussions around Switzerland's international position and neutrality, and Credit Suisse's situation even have a negative impact?
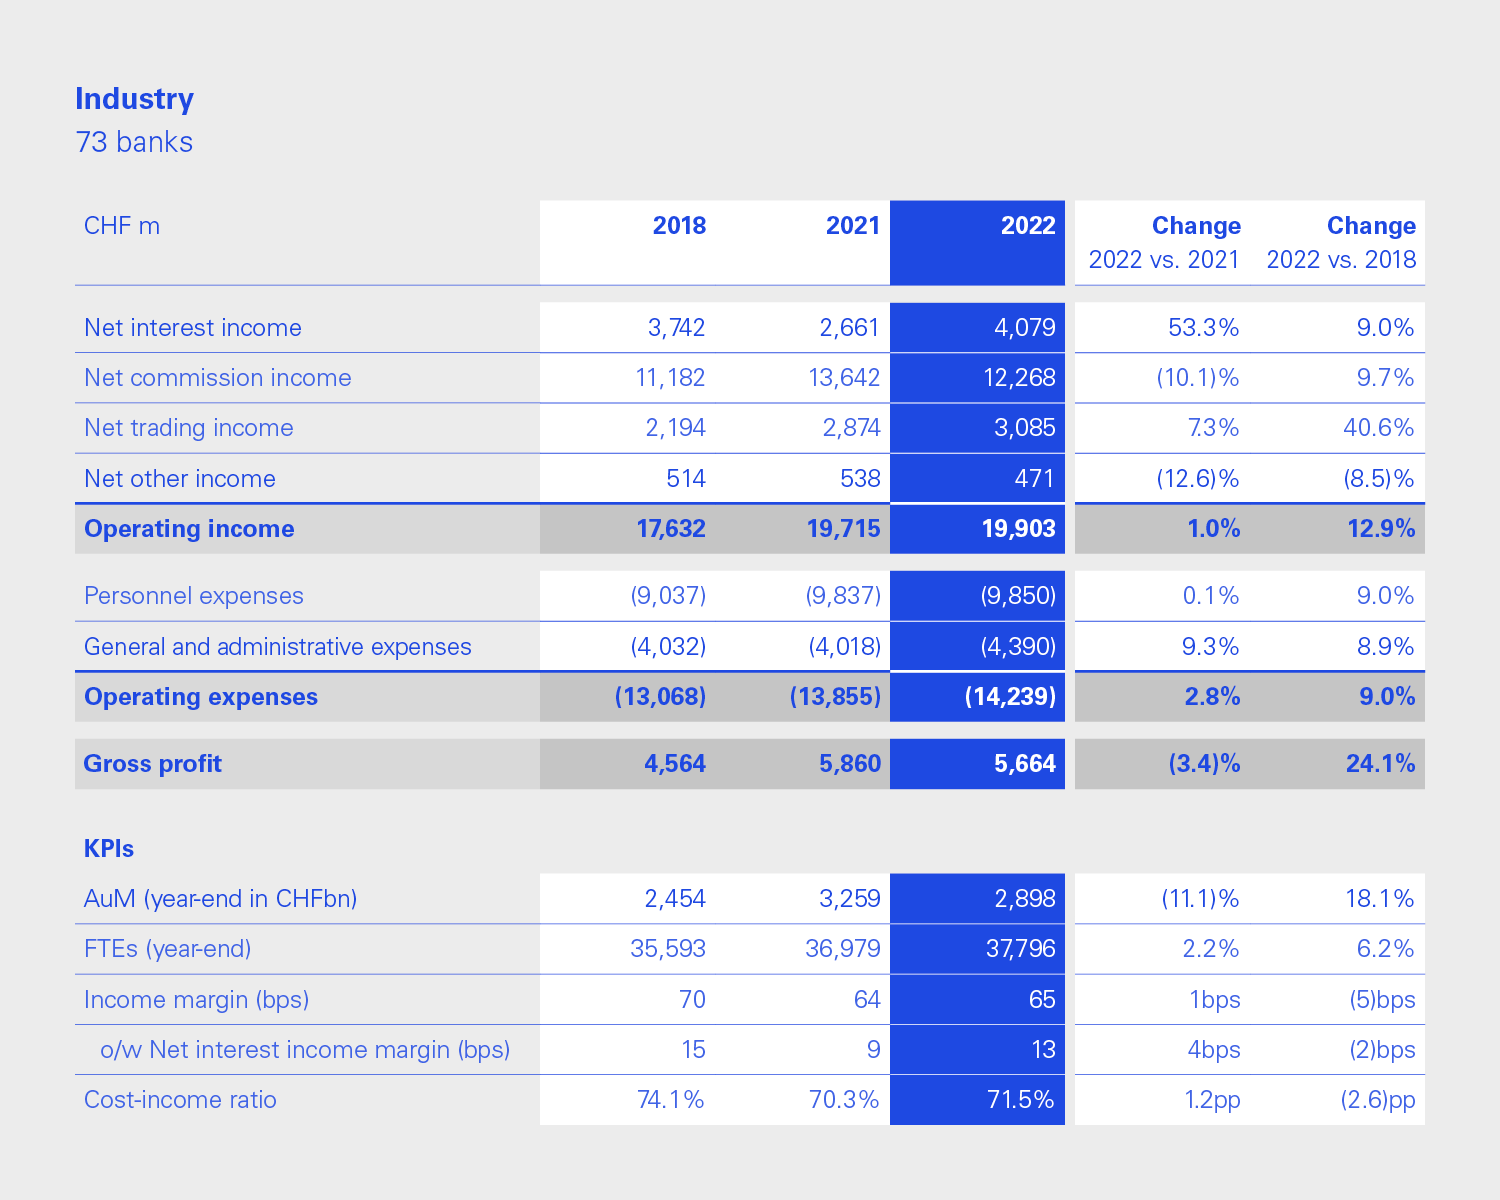
Aggregated financials of 73 private banks
> Click on the image to enlarge it
Large banks drive the industry's profit and loss
Large banks made up 83% of the industry's gross profit and 77% of its AuM. They therefore drive the profit and loss statement for the industry. You can read more about the performance and drivers of the various size clusters here.
Interest boosts revenue and stabilizes gross profit
After a record 2021, the industry performed strongly despite the challenges and uncertainties, and lower AuM and NNM, that 2022 brought.
The return of positive interest rates came at the right time to compensate for the fall in commission income, resulting in gross profit being only 3.4% lower than in 2021 – at small and medium banks even being higher than in 2021. Stable personnel expenses played their part.
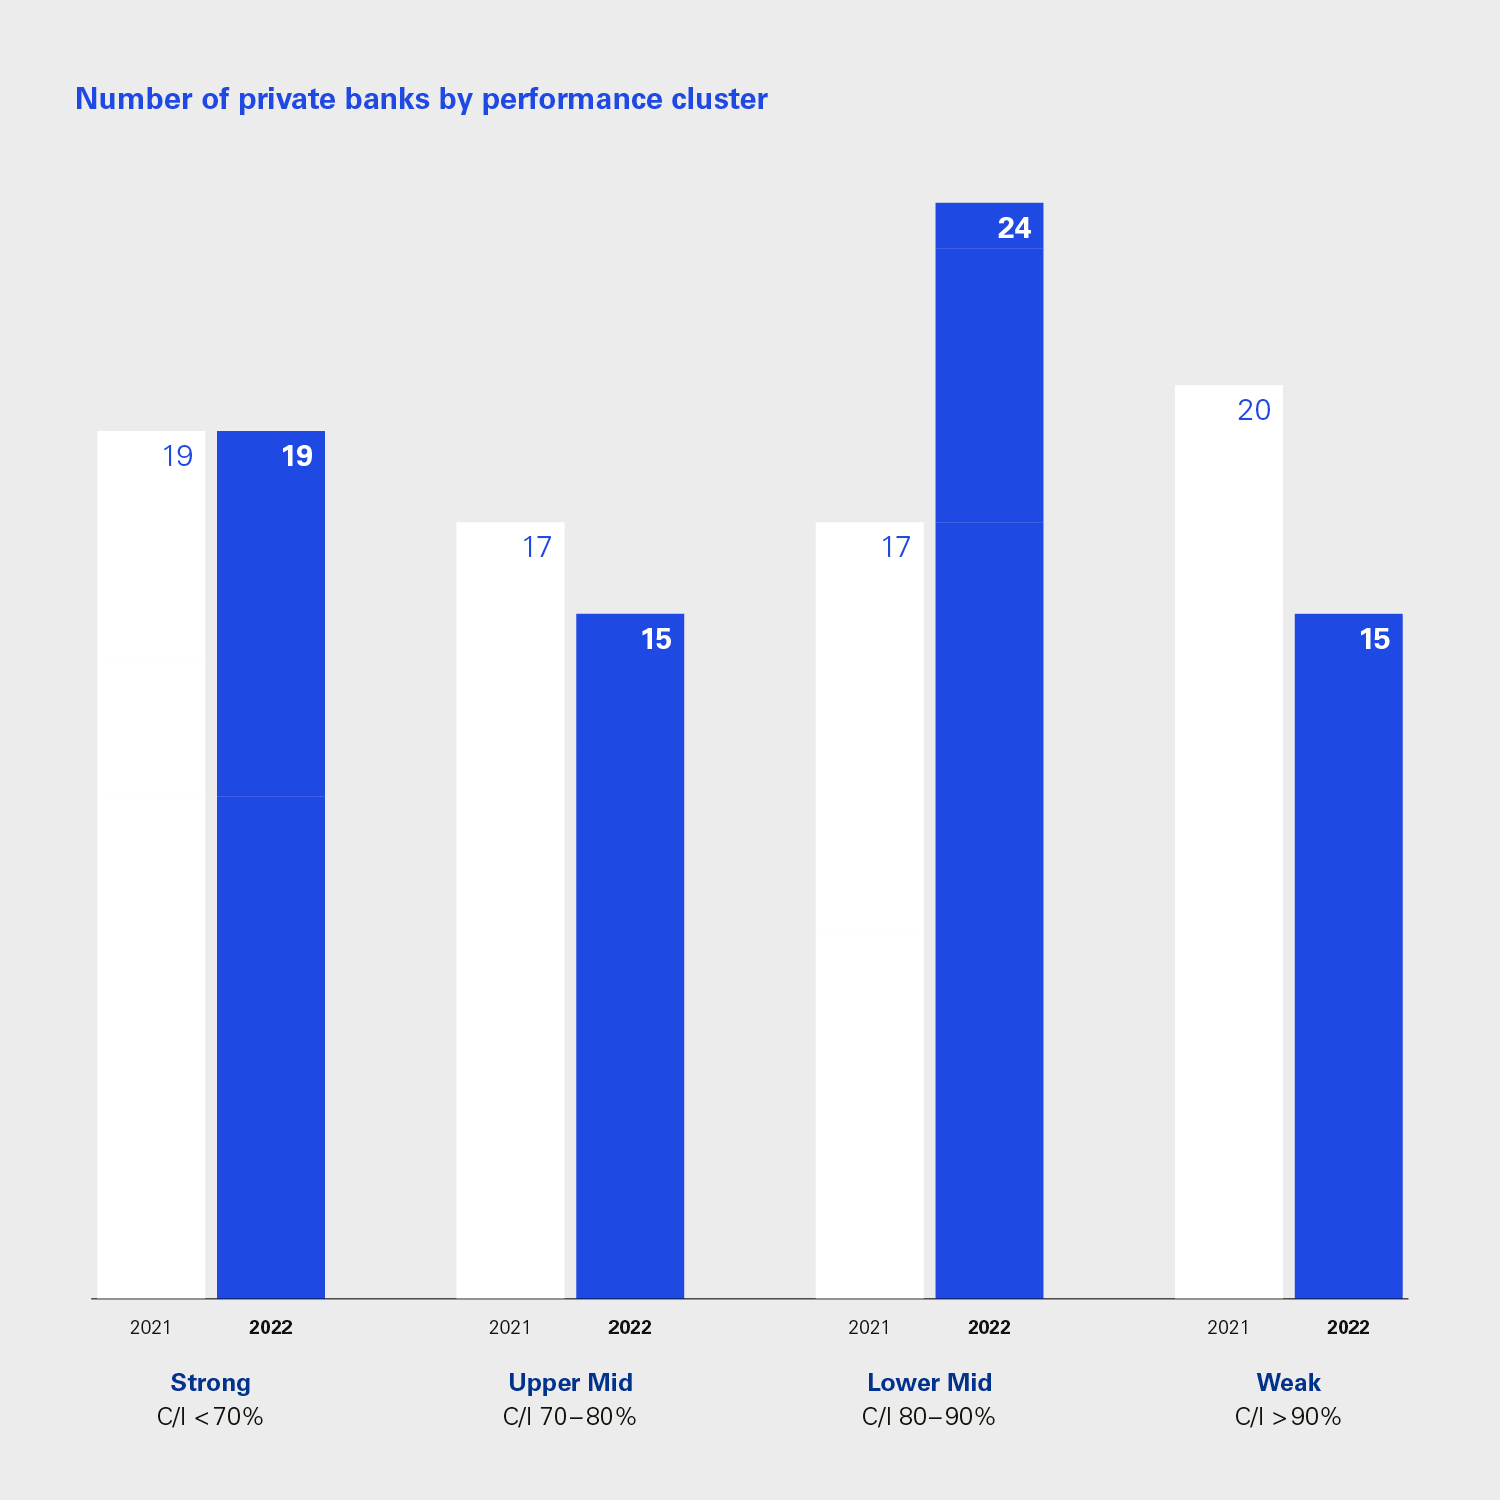
Cost-income ratio (C/I) as a profitability metric
We use C/I as the key profitability metric to determine the performance clusters. C/I has the advantage of being less affected by exceptional items and differing bank sizes. This makes it useful for a level playing field.
The performance clusters are grouped by C/I:
- Strong <70%
- Upper Mid 70%-80%
- Lower Mid 80%-90%
- Weak >90%.
The bottom end of the industry improves
The biggest changes happened at the bottom end of the industry, where the number of weak banks and loss-making banks fell sharply (20 in 2021 versus 15 in 2022, 15 respectively 7 of them loss making). This improvement was driven by a group a small banks that enhanced their performance by achieving strong NNM, limiting the fall in commission income, and significantly increase interest income. Their investment in recent years to develop their businesses seems to be paying off.
While it is positive that the distributions of banks improved in such a challenging year, more than half of banks still have a cost-income (C/I) ratio of more than 80%. The question is how the 39 banks in the lower-mid and weak clusters can improve their performance, or how many should sell their businesses.
Banks in the strong cluster meanwhile continue to push ahead, increasing the median RoE from 8.1% in 2021 to 11.5% in 2022. Their challenge is how to grow their successful businesses further while improving their C/I.
Number of private banks by performance cluster
> Click on the image to enlarge it