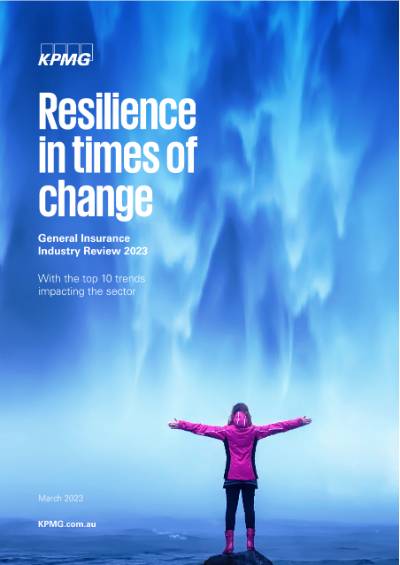
2022 was a year of catastrophic weather-events, high inflation, and regulatory change. The industry continues to face evolving challenges and opportunities. Resilience in these times of change is critical.
The 2022 profit from direct insurers of $4,949 million was up 42 percent (2021: $3,483), a five year high. The increase was largely driven by a 10 percent increase in gross written premium on the back of higher premium prices. Increased claims costs were largely mitigated by these higher, average gross written premium prices, with insurers continuing to price products to reflect claims inflation, natural hazards expectations and higher reinsurance costs.
Results at a glance
Direct Insurers 31/12/2018 – 31/12/2022
| 2022 | 2021 | 2020 | 2019 | 2018 | |
|---|---|---|---|---|---|
Gross written premium $m ● |
59,364 | 53,781 | 48,625 | 46,271 | 44,111 |
Net earned premium $m ● |
40,286 | 36,003 | 33,703 | 32,967 | 31,217 |
Underwriting result $m ● |
6,125 | 3,562 | (186) | 2,211 | 3,443 |
Insurance profit $m ● |
4,949 | 3,483 | 930 | 4,070 | 4,609 |
Investment income $m ● |
(1,257) | 509 | 1,452 | 2,984 | 1,912 |
Loss ratio ● |
62% | 66% | 75% | 69% | 65% |
Expense ratio ● |
23% | 24% | 25% | 25% | 24% |
Combined ratio ● |
85% | 90% | 101% | 93% | 89% |
Insurance margin ● |
12% | 10% | 3% | 12% | 15% |
Capital ratio ● |
1.72 | 1.69 | 1.68 | 1.67 | 1.74 |
Source: APRA Annual General Insurance Performance Statistics Dec 2022 (Direct Insurers only) and KPMG analysis.
The outlook
The expectation of increasing frequency and severity of natural hazards, rising reinsurance costs, increasing inflation, supply chain issues and labour shortages will continue to put upwards pressure on premiums pricing. It is anticipated that on average, premiums will rise by at least 10 percent throughout 2023.
Top ten trends for 2023
In the report, we discuss the implications of ten key trends which will impact Australian insurance companies in both the short and long term. Improving resilience and thereby reducing the impact of extreme weather events on Australian communities is a key focus for the industry.
Consistent with our 2022 Insurance CEO Outlook, CEOs globally believe that technology and ESG are amongst their highest priorities and these trends feature heavily within the Top 10 trends for Australian insurers. Download our report to explore the top ten trends for 2023.
1. Resilience
2. Reinsurance
3. Technology modernisation
4. ESG
5. Simplification and cost optimisation
6. Changing customer expectations
7. Cyber
8. Data
9. IFRS 17
10. Regulatory and compliance transformation
Download the full report
View our interactive dashboard
KPMG's General Insurance Insights Dashboard contains a range of interactive charts and graphs presenting the key industry metrics for the past 5 years. The interactive dashboard enables the data to be filtered to view the metrics for a particular year or insurer. It also enables comparison of metrics for an individual insurer to others in the market.


