KPMG report: Key takeaways from the OECD’s 2021 mutual agreement procedure (MAP) statistics
Overview and country-specific statistics
Overview and country-specific statistics
Overview
The Organisation for Economic Cooperation and Development (OECD) on 22 November 2022 released the latest mutual agreement procedure (MAP) statistics and awards covering 127 jurisdictions for the calendar year ended 31 December 2021.
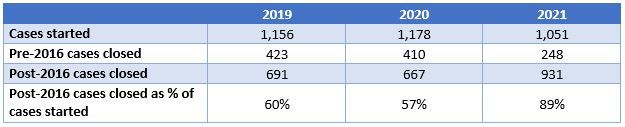
The statistics highlight a number of positive trends. Tax administrations have closed the gap between the number of cases started and closed. In 2021, cases started exceeded the number of post-2016 cases closed by just over 10% (see Table 1 below).1 It is important this “success story” is not overstated. The decline in new cases is likely an after-effect of pauses on audit activity during the early phases of the COVID-19 pandemic. As tax authorities resume and ramp up audit activity, strains on MAP inventories are likely to return.
Table 1: Change in transfer pricing cases over the past four years
MAP outcomes are generally positive, with 65% of transfer pricing cases being fully resolved in MAP through the full elimination of double taxation or unilateral relief. Consistent with 2020 data, only 5% of cases closed in 2021 resulted in either no agreement or only partial relief via MAP. An important trend that has emerged in the 2020 and 2021 statistics is that a larger proportion of cases are being resolved through granting unilateral relief or a domestic remedy (around 20%), up from around 10% in 2019.2 A positive development for taxpayers, given its potential to expedite the MAP process.3
One of the aspects of the statistics which is least well understood is the significance of the number of cases withdrawn by the taxpayer—the proportion of cases falling into this category was 14% in 2020 and 11% on 2021, markedly higher than for earlier years. The MAP Statistics Reporting Framework [PDF 252 KB] does not elaborate on what circumstances this covers beyond stating that if the case is withdrawn by the taxpayer following the resolution of the issues through remedies provided by the domestic law of a Contracting Party, that case shall be reflected as a case closed with the outcome “resolved via domestic remedy.” For some countries this withdrawal figure represents a substantial element of the number of cases closed in 2021, for example Switzerland (39%) and Italy (15%).
The MAP statistics prepared by the OECD contain a lot of country-specific detail that is often lost in the headlines and awards, but which companies can use to help assess whether and when MAP might be the right way to resolve transfer pricing disputes. This is the issue on which the rest of this article is focused.
Country-specific statistics
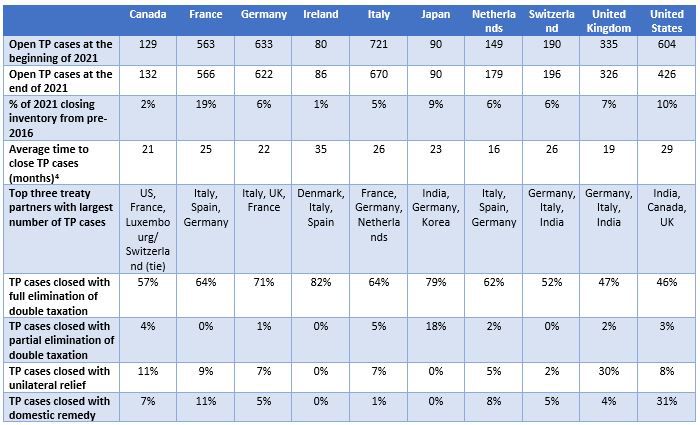
The table shows a number of interesting trends:
- With the exception of the Netherlands and the United States, the countries in this table had a similar number of open post-2015 transfer pricing at the beginning and end of 2021. The United States was most successful outlier, reducing its outstanding caseload by 29%, including a significant reduction in unresolved pre-2016 cases. The Netherlands a less successful outlier, seeing its outstanding caseload rise by 20%.
- Transfer pricing cases still take a long time to resolve—but there are significant variations between countries. The Netherlands closes cases in an average of 16 months, whereas France takes 25 months, Italy 26 months and the United States 29 months.
- These headline numbers hide variation. Italy generally takes a long-time to resolve cases but resolves some very quickly. Almost 20% of France’s closing 2021 inventory relates to cases which are over six years old. The United States generally resolves cases quicker but takes a long time to resolve cases with India, Indonesia, and Italy. In addition, results can vary significantly year-over-year, and the resolution of remaining pre-2016 cases can have a sizeable effect on a jurisdiction’s overall resolution timeframe.
- Some countries—Germany and Italy—are responsible for a disproportionately large number of MAP disputes, judged by the frequency with which they crop up in the top three treaty partners with the largest number of outstanding transfer pricing cases. Interestingly, the proportion of pre-2016 cases in closing 2021 inventory for Germany and Italy was relatively low by comparison with France and the United States, indicating that Germany and Italy are struggling with new cases, whereas France and the United States face challenges closing older cases.
- Japan has a strong record of resolving cases bilaterally through MAP (97% of cases closed in 2021) but 18% of cases only resulted in partial relief.
- The United Kingdom is using unilateral relief in far more cases than the other countries above, which may explain its strong performance in average time to close cases in 2021 (19 months).
- Taxpayers that enter MAP and see the process through are generally able to successfully resolve disputes in MAP. This may take the form of an agreement between the competent authorities or one competent authority’s grant of unilateral relief or an alternative domestic remedy.
Is MAP right for me?
Looking at trend data is helpful to get a big picture sense of how effectively MAP is operating at a global or country level, but it sometimes masks the key issues that taxpayers need to be looking at and considering when they think about entering into MAP.
For example, imagine a transfer pricing dispute involving a German and Italian entity. What do the OECD MAP statistics tell you? The first thing to know is you will not be alone. In 2021, 37 taxpayers opened transfer pricing MAP cases covered by the Germany-Italy treaty, on top of the 137 existing cases in inventory. You might think this does not bode well for your chances of a successful outcome, but in 2021 the German and Italian competent authorities reached agreements resulting in full relief from double taxation in 57 cases, which represented 81% of resolved cases. So, the process for resolving a dispute between Germany and Italy might take a while, but it is getting quicker and is likely to result in the full relief of double taxation.
Alternatively, imagine you are facing a dispute involving a transaction covered by the UK-US treaty. In 2021, there were only four new UK-US MAP cases started on top of 48 outstanding cases. The vast majority of cases closed by the UK and United States in 2021 were resolved through unilateral relief—a full 21 of the 23 cases resolved. So, if you have a UK-US dispute, making a MAP submission may make some sense, even if you are seeking unilateral relief—especially as pursuing MAP is generally necessary to obtain foreign tax credits in the United States.
Conclusion
The OECD’s MAP statistics shine a spotlight on MAP and incentivize competent authorities to make this key dispute resolution more effective. The MAP awards might not quite be the Oscars, but a gong is a gong, and tax authorities’ ongoing efforts to improve MAP deserve celebration.
For taxpayers, the statistics provide helpful insights into the effectiveness of particular MAP relationships—and the likelihood that a particular case will be resolved in an efficient and timely manner. If you have a dispute, these statistics are definitely worth a read.
It will be interesting to see if there are any further enhancements to the statistical reporting in future. The OECD published a consultation in November 2020 that contained three proposals for the reporting of additional data under the MAP Statistics Reporting Framework aimed at providing more transparency and clarity on jurisdictions’ MAP inventory. Three additional data points were proposed:
- Indicating which jurisdiction made the adjustment or took the action at issue
- A breakdown of the time taken to close MAP cases per type of outcome
- The year the MAP cases pending at year-end were initiated
These statistics may not be as headline grabbing as BEPS 2.0 but provide a real benefit for taxpayers, when they are considering whether to pursue MAP. For this reason, KPMG tax professionals very much hope that the OECD is able to further enhance its (already impressive) MAP statistics in future releases.
For more information, contact a KPMG tax professional:
Sean Foley, KPMG Global Transfer Pricing Dispute Resolution Leader
T: +1 202 415 4395
E: sffoley@kpmg.com
Thomas Bettge, KPMG Washington National Tax, Senior Manager
T: +1 202 533 3246
E: tbettge@kpmg.com
Alistair Pepper, KPMG US Tax Services (London), Washington National Tax, Managing Director
T: +44 7854 011961
E: alistairpepper@kpmg.com
Phil Roper, KPMG in the UK, Partner
T: +44 7917 603344
E: phil.roper@kpmg.co.uk
1 Pre- and post-2016 cases are counted using different methodologies. An agreed methodology means that post-2016 cases are counted once. In contrast, pre-2016 cases are generally counted twice, as they are recognized by both jurisdictions that are party to the MAP cases. This means that the pre- and post-2016 cases numbers cannot be compared directly. For more details see, OECD, Frequently Asked Questions on the Mutual Agreement Procedure (MAP) Statistics (2021).
2 The distinction between “unilateral relief granted” and “resolved through domestic remedy” is subtle. The OECD defines “unilateral relief granted” as situations where a competent authority receives a MAP request and is able to provide a “satisfactory solution” on a unilateral basis. The OECD defines “resolved through domestic remedy” as situations where the issues raised by a MAP request are resolved through domestic remedy, while the MAP request is pending, or where a taxpayer withdraws a MAP request following the finalization of a domestic remedy. For more information on the definition of “unilateral relief granted” and “resolved via domestic remedy” see OECD, BEPS Action 14 on More Effective Dispute Resolution Mechanisms – Peer Review Documents (2016), p. 49; and OECD, Frequently Asked Questions on the Mutual Agreement Procedure Statistics (2021), pp. 5-6.
3 For a comprehensive discussion of how to interpret the OECD’s MAP Statistics see Bettge, T., Foley, S., Katz-Pearlman, S., and Martin, M., “MAP: Past, Present, and Future”, Tax Notes International (2021).
4 Cases started as from 1 January 2016 only
The KPMG name and logo are trademarks used under license by the independent member firms of the KPMG global organization. KPMG International Limited is a private English company limited by guarantee and does not provide services to clients. No member firm has any authority to obligate or bind KPMG International or any other member firm vis-à-vis third parties, nor does KPMG International have any such authority to obligate or bind any member firm. The information contained herein is of a general nature and is not intended to address the circumstances of any particular individual or entity. Although we endeavor to provide accurate and timely information, there can be no guarantee that such information is accurate as of the date it is received or that it will continue to be accurate in the future. No one should act on such information without appropriate professional advice after a thorough examination of the particular situation. For more information, contact KPMG's Federal Tax Legislative and Regulatory Services Group at: + 1 202 533 3712, 1801 K Street NW, Washington, DC 20006.