Market Update: Oil & Gas - July 2016
Market Update: Oil & Gas - July 2016
Bearish sentiment has arisen over what appears to be a supply and demand imbalance.
Oil: Supply and Demand Imbalance Fuelling Anxiety
Oil investors may gain another investment opportunity at sub US$45/bbl. After a price rally in 2Q 2016 saw ICE Brent contracts topple US$50/bbl, the international crude markets are becoming nervous again over the risks posed by the global economic outlook.
Uncertainty stemming from the UK’s decision to leave the European Union, a stronger U.S. dollar and robust oil output from OPEC have all cumulated to add downward pressure on oil prices. Once again, bearish sentiment has arisen over what appears to be a supply and demand imbalance.
On the one hand, uncertainty concerns from the UK’s vote to leave the EU has hit global markets hard. On the day of the referendum itself, crude prices plunged 5 percent. This, combined with concerns over China’s oil import trajectory has contributed to the falling oil prices this month. On the other hand, strong supply output from the OPEC countries, Canada and Libya has not restrained the supply pull-back that some bullish investors were hoping.
Upstream M&A activity starts to slowly flow again
After months of depressed deal activity, we are starting to see the re-emergence of a deal market within the upstream oil and gas sector once again. The latest data for the first half of 2016 shows that total global spend on upstream M&A in Q2 2016 rose significantly, up 38% on the first quarter (source Oil & Gas Financial Journal). One trend that is helping to get these deals done, is the use of different structural arrangements to help overcome some of the challenges presented by the low oil price, and the corresponding valuation gap between buyers and sellers.
Over recent months we have seen a couple of innovatively structured transactions in Norway, which have been the result of realigning portfolios, and to a degree, providing much needed capital to some of the mid-cap players. Statoil’s sale of its stake in the Norwegian oil field, Edvard Grieg, to Lundin Petroleum in return for a greater shareholding in Lundin, and the creation by BP and Det Norske of a new Norwegian exploration and production joint venture called Aker BP, are both examples of inventive deals to realign portfolios.
"We are seeing a greater appetite for transactions that have a contingent element. This could be based on future pricing, as well as future profitability or efficiency improvements. Furthermore, the majors remain keen to divest non-core assets to other, smaller and potentially more nimble players, who may be able to provide a greater focus and a different skill set. This is particularly true with respect to late life assets. We believe this trend is likely to continue and should provide a slow uptick in deals in the sector."
– Mark Andrews, Head of Oil & Gas, KPMG in the UK
Geopolitical Forces Shaping Asian Shipping Markets
The attention of the oil and shipping markets turned to the South China Sea in July, after an international arbitration court ruled against Beijing’s territorial claims over large areas.
The tribunal found that China’s exploration activity had impinged upon the sovereignty of the Philippines and had no legal case to supports its claims in the South China Sea – a key trading artery between Europe, the Middle East and Asia. Beijing has rejected the ruling, asserting that its "territorial sovereignty and marine rights" will not be affected, and permeating uncertainty across the region. In the face of Beijing’s reaction, Brent Crude futures rose over 2 percent. Geopolitical unrest has been an increasing feature in the Asian region, with a variety of countries laying territorial claims to islands in the waters of the South China Basin between the Spratly and Paracel Islands.
"In light of the huge energy demands of the region, foreign policies dictated by access to energy sources are likely to become the ‘modus operandi’ of many nations and as a result, flash points could arise, impacting critical supply and demand choke points.
Since the oil price drop of 2014, China has pursued, as part of an energy security strategy, an approach to build up its strategic petroleum reserves (SPR). This Chinese oil import demand stemming has offered oil markets a much needed price support and played a lead role in the recent price rally that saw international benchmarks touch US$50/bbl. However, it is anticipated the China’s SPR is at near full capacity. Once maximum capacity has been reached, Chinese oil imports are likely to decline significantly. With the Chinese refinery production at a peak highs, the products space is heavily oversupplied. A plunge in oil prices now with so much oversupply of products, could cause further distress amongst products distributors."
– Oliver Hsieh, Director, Commodity & Energy Risk Management for ASEAN, KPMG in Singapore
U.S. Natural Gas – Supply and Demand Slowly Rebalancing
Market comment:
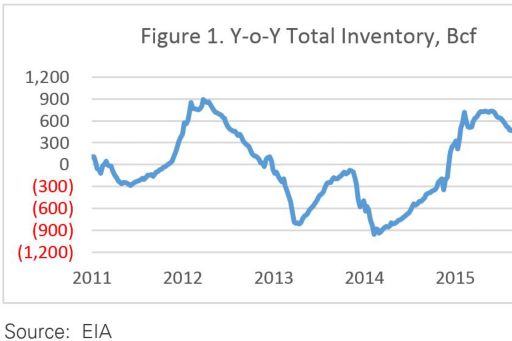
Recent rebalancing of U.S. natural gas supply and demand has lifted prompt futures prices from their lowest level in four years. The combination of production declines and increased demand for power generation and exports has reduced the year-over-year (y-o-y) inventory surplus by 500 Bcf since March. Prompt futures prices have almost doubled over the same time period. A warm summer and continued producer restraint could help support recent price increases into the winter.
On a y-o-y basis, total U.S. natural gas inventory peaked in March at a surplus of 1,014 Bcf. The current year’s surplus exceeded the previous high of 894 Bcf established in March, 2012. As of last week’s EIA Weekly Natural Gas Storage Report, the y-o-y surplus has been halved to 513 Bcf. (Figure 1).
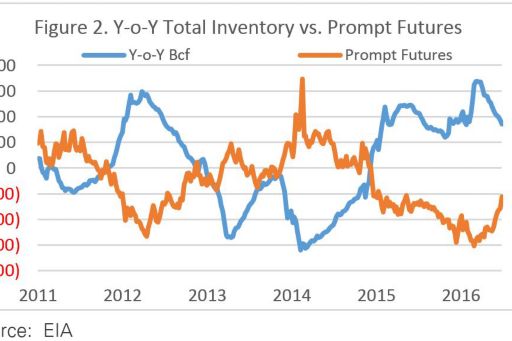
Prompt Henry Hub natural gas futures prices seem to be inversely related to the y-o-y storage level. Prompt futures prices bottomed when the y-o-y surplus reached maximum levels in both 2012 and 2016. Prompt futures also peaked in 2013 and 2014 when y-o-y inventory levels were at relative minimum values. (Figure 2.)
Rebalancing of the U.S. natural gas market has been driven by both supply declines as well as a demand response to lower absolute price levels. According to the July 7 EIA Natural Gas Weekly Update Report, U.S. dry gas production has declined by 0.6 Bcfd compared to the same reporting week last year. This production decline is primarily attributable to the sharp decline in rig activity over the last year. The most recent gas-directed rig count was 81 rigs compared to 169 rigs operating at this time last year. Total supply is only 0.3 Bcfd below year ago levels due to an offsetting increase in Canadian imports (Table 1).
Table 1. U.S. natural gas supply - Gas week: (6/30/16 - 7/6/16)
| Average daily values (Bcf/d) | |||
| this week | last year | y-o-y | |
| Dry production |
73.5 | 74.1 | (0.6) |
| Net Canada imports | 6.4 | 6.1 | 0.3 |
| LNG pipeline deliveries | 0.2 | 0.2 | 0.0 |
| Total supply | 80.1 | 80.4 | (0.3) |
Source: EIA
Increased demand for natural gas has been primarily due to increased utilization for power generation, increased LNG exports, and higher exports to Mexico. These demand increases are partially offset by a decline in residential/commercial usage. Total natural gas demand is about 2.1 Bcfd higher than a year ago which brings the net surplus 2.4 Bcf below last year’s level (Table 2).
Table 2. U.S. natural gas consumption - Gas week: (6/30/16 - 7/6/16)
| Average daily values (Bcf/d): | |||
| this week | last year | y-o-y | |
| U.S. consumption | 59.1 | 58.1 | 1.0 |
| Power | 32.3 | 30.1 | 2.2 |
| Industrial | 19.5 | 19.5 | 0.0 |
| Residential/commercial | 7.3 | 8.5 | (1.2) |
| Mexico exports | 3.7 | 3.2 | 0.5 |
| Pipeloss fuel use/losses | 6.4 | 6.3 | 0.1 |
| LNG pipeline receipts | 0.7 | 0 | 0.7 |
| Total demand | 69.8 | 67.7 | 2.1 |
| Net long/(short) | 10.3 | 12.7 | (2.4) |
Source: EIA
– Thomas Ruck, Director, Market/Treasury Risk, KPMG in the US
Analyst estimates: oil
| 2016 | 2017 | 2018 | 2019 | |
| May Avg | 42.1 | 56.6 | 71.6 | 75.4 |
| June Avg | 42.6 | 57.1 | 72.0 | 76.1 |
| May Median | 42.7 | 55.0 | 70.0 | 75.0 |
| June Median | 42.5 | 56.3 | 70.0 | 75.0 |
Analyst estimates: gas
| 2016 | 2017 | 2018 | 2019 | |
| Min | 2.1 | 2.4 | 2.9 | 3.2 |
| Average | 2.3 | 3.0 | 3.4 | 3.5 |
| Median | 2.3 | 3.0 | 3.2 | 3.5 |
| Max | 2.8 | 3.5 | 4.0 | 4.0 |
| 2016 | 2017 | 2018 | 2019 | |
| May Avg | 2.3 | 3.0 | 3.3 | 3.5 |
| June Avg | 2.3 | 3.0 | 3.4 | 3.5 |
| May Median | 2.3 | 2.9 | 3.3 | 3.5 |
| June Median | 2.3 | 3.0 | 3.2 | 3.5 |