
With environmental, social and governance (ESG) rising on leadership agendas globally, tax practices and governance are becoming critical ESG measures, with tax transparency often being used as a key metric for demonstrating a responsible attitude towards tax. One thing that has become clear, however, is that not all businesses are at the same point in their tax transparency journey and not all have the same tax transparency destination.
Now that the EU Parliament has also voted in favour of the EU Directive on public Country-by-Country Reporting (CbCR), large MNEs only have a few years left before having to disclose their corporate income tax payments for their EU activities. Preparing this annual disclosure will be a significant undertaking – not only to ensure the completeness, accuracy, and consistency of the tax data, but also to write a compelling narrative to accompany the data and have strong governance arrangements in place to validate and approve the report.
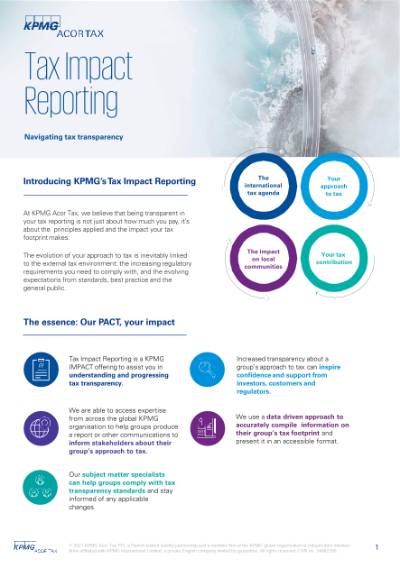
KPMG Tax Impact Reporting can assist in understanding and progressing tax transparency within your business, helping to inspire both confidence and support from investors, customers and regulators. Through this service offering, KPMG Acor Tax and KPMG professionals from around the world can help your tax department inform stakeholders of your business’s approach to tax, use data-driven methodologies to help accurately compile information on your tax footprint, provide guidance for compliance with tax transparency requirements and standards, and use leading technology solutions to support your business on its journey.
KPMG Tax Impact Reporting technology tools
KPMG Tax Footprint Analyzer
The KPMG Tax Footprint Analyzer is a data extraction tool that can extract each “taxes paid” amount from every group company to show your group’s global tax footprint. It uses automated data extraction tools, accessing data from the underlying ERP tables and other sources. The tool performs data integrity checks and performs data analysis routines to support the validation process. The results are presented in a dynamic interactive visualization dashboard that allows users to drill down to a deep level of detail and further visualization customization.
Contact us

Søren Dalby
CEO and Partner
KPMG ACOR TAX
Mikkel Papendick Andersen
Director, Global Compliance & Transformation
KPMG ACOR TAX
Simon Tornø Olesen
Manager, Compliance Management & Transformation
KPMG ACOR TAX
Francois Marlier
Manager, Sustainability & ESG in Tax
KPMG ACOR TAX