VIDEO: Road access
VIDEO: Road access
Roads are much more than just asphalt and lights. They are vital arteries along which society and development thrive.
Roads are much more than just asphalt and lights. They are vital arteries along which commerce, society and development thrive; they unlock the value of government services; and they allow citizens to lead more active, social and productive lives. But poorly planned or maintained road networks can create serious challenges for cities and their citizens.
Defining the service
Road Access services incorporate the design, construction, maintenance, repair and operation of city and urban roads, bridges, tunnels and boulevards. Significant focus was placed on determining the ‘lane kilometers (km) of road’ (calculated by multiplying the total km length of roadways by the number of lanes provided) to standardize benchmark results.
Topline findings
- The average city spends approximately US$15,900 per lane kilometer of road
- The median city boasts 73 percent of roads in good condition
- Vehicle accident rates vary across the world but are exponentially higher in large cities
- Different approaches to allocating capital costs significantly impact unit costs per lane kilometer.
Benchmarking analysis
Efficiency
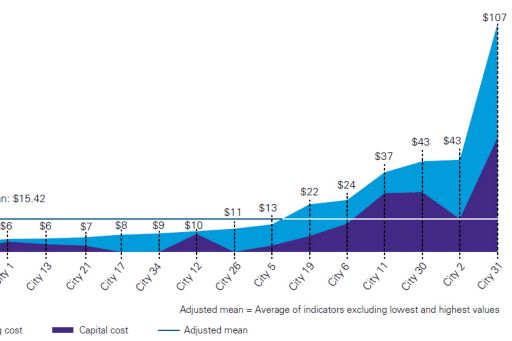
Operating and capital cost per lane kilometer of road. This measure reflects the costs (both operating and capital) for city roads averaged out by the number of lane kilometers of road in the city.
Points to consider:
- The combined operating and capital costs for a lane kilometer of road range from US$3,000 - $107,000 depending on the city. When the operating and capital costs are separated, evidence suggests that some cities provided little to no capital costs while others spend more capital than operating funds.
- For many of the 16 participating cities, there is a reasonable ratio of capital to operating costs but what separates a city spending US$3,000 / lane km from another spending $107,000 / lane km? One explanation can be attributed to the location of cities relative to extreme weather or potential long-deferred maintenance. For example, City 20 may not experience extreme winter conditions such as that evidenced by City 31.
- Few if any cities qualified the cost information they provided by stipulating what was included/excluded. Some did inquire about whether they should include street lighting costs, but by and large cost information was provided in an unqualified manner. Further work in qualifying road costs would enable us to derive better cost indicators than available at this point.
- Benchmarking the cost of roads is still in its early stages. Advice on the optimal cost for a lane kilometer of road still requires further research where US$15,000 / lane kilometer (adjusted mean) may be appropriate or biased based on those cities that participated and their operating and capital costs. More observations will aid in closing in on such a cost target.
Operating and capital cost per lane km of road
Effectiveness
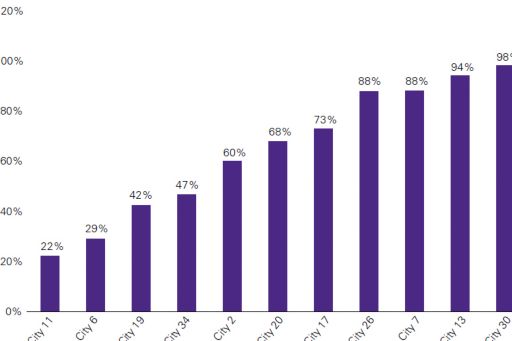
Percent of roads in good condition. While the exact methodologies for assessing road conditions vary by city, this measure asked respondents to report the percentage of roads classified as being in ‘good’ or ‘excellent’ condition according to their specific rating system.
Points to consider:
- KPMG mapped out several effectiveness indicators. One indicator was the percentage of roads in good condition. Clearly cities around the world will use different methods for ranking road condition rating, and one of the discoveries along the way was to see what different methods cities might use. Unfortunately KPMG did not receive any information about these methods. At one level, a city might argue that we are again comparing cities that use different techniques. However, at another level the good condition rating of a city in a developing country might equate to the same good condition rating for a city in a developed country where the perspective of “good” may be substantially different in comparison.
- One observation worth noting is that no city should rank all of their roads in good condition although some claim this to be case. Every city in the world is struggling to keep on top of road repair and reconstruction leading to road condition ratings that are below 100% in good condition. Furthermore, cities are struggling to justify sufficient capital expenditures to sustain their roads now and the foreseeable future so road condition ratings clearly should suffer in years to come.
- Developing an international standard for measuring the road condition would be extremely worthwhile. Who should develop such a standard and is there a role for KPMG to play in helping in such a collaboration?
Percent of roads in good condition
Number of vehicle accidents. Traffic accidents for a given year have also been analyzed to observe any correlations with road conditions. If they occur frequently on city roads, may be an indicator that the road design is flawed.
Persistent problems
- Underdeveloped road infrastructure
- Deteriorating road quality
- Congestion and increasing volume
- Tighter environmental requirements
- Shifting attitudes towards public transportation
- Short construction windows in climate affected regions
- Aligning service contracts to outcome expectations
- Investing in human capital and capacity Development
Distinguishing cost factors
- Weather-related impacts and maintenance requirements
- Capital costs and the degree of asset lifecycle replacement
- Service levels and corresponding technical considerations
- Density of city and congestion on roads
- Presence of tunnels, bridges and special road construction materials (e.g. cobblestone roads)
- Asset complexity and variation
Innovative ideas
- In Kazan, Russia, authorities have invested in an automated traffic control system that has helped the city increase road capacity by 15 to 20 percent and improved average speeds by 25 percent.
- Philadelphia’s Vision Zero initiative aims to improve street safety and network integration through infrastructure improvements focused on traffic, pedestrian and bicycle safety.
- Cape Town’s City Council has approved the use of modified asphalts such as A-E2 and A-R1 on marginal pavements and is trialing grey water-resistant asphalt near informal settlements.
- Authorities in Medellin, Columbia are shifting to electric tramways and aerial cables to improve lane kilometers and reduce congestion. — The Sunshine Coast Council publishes a ‘schedule of work program’ that provides citizens with timeframes for projects conducted as part of the city’s annual road reseal and rehabilitation program Transformative trends
- Shifting customer expectations and demand: The widespread adoption of personal navigation apps, car sharing models and vehicle autonomy tools is changing demand for roads.
- Adopting new approaches: Traffic flow systems, free flow models and other alternative models can help reduce road volume and better manage new capital costs.
- Promoting traffic safety: Many cities are looking at ways to improve overall road safety for vehicles, pedestrians and bicycles while simultaneously improving traffic flow.
- Improving outsourcing: Municipalities are rethinking their existing outsourcing agreements to understand how value is created and captured.
- Leveraging data: As cities become smarter, many are using this data to drive improvements in operations, planning and investment.
Combined efficiency and effectiveness analysis
Points to consider:
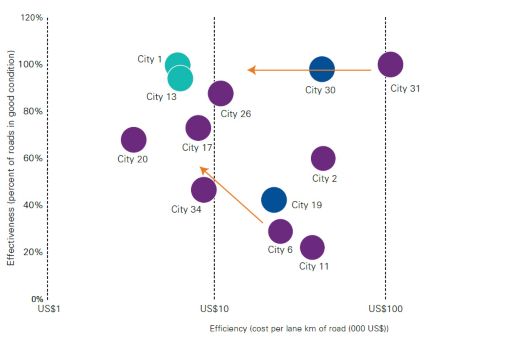
- A new performance perspective on roads combines the efficiency and effectiveness indicators. The graph illustrated below combines the cost per lane kilometer (km) of road (efficiency) with the percent of roads in good condition (effectiveness) to demonstrate how cities might present a more compelling picture of performance. In this example, the cost per lane km of road (efficiency) is combined with the road condition rating (effectiveness). Twelve cities provided sufficient information to generate this fascinating picture of roads.
- The ideal position in this chart is to be in the upper left quadrant, like cities 1 and 13. While one might question whether any city can attain 100 percent of its roads in good condition, this graph shows that not only was City 1 in this enviable position, but they were also really efficient spending less than US$10,000 per lane km of both capital and operating funds to achieve this state.
Road access - combined efficiency and effectiveness