Park access
Park access
Access to a park encourages healthy living and builds stronger communities.
Access to a park encourages healthy living and builds stronger communities. Yet few cities have a clear understanding of how many people actually use their parks. Few cities doubt the tremendous value that their parks provide, but unfortunately they find difficulties in sustaining their park budgets with only a partial picture of how parks are performing. It’s time to take a closer look at our parks.
Defining the service
Park access services include the design, construction, maintenance, repair and operation of parks. These may include active parks and parkettes, sports fields and public open spaces such as ravine lands, urban forests and scrubland. Recreational facilities within parks may or may not be included.
Topline findings
- On average, cities spend US$12,730 per hectare of parkland.
- Spend on parks ranged from US$3,200 per hectare to US$54,900 per hectare.
- Most cities report at least 90 percent of population living within proximity to a park.
Benchmarking analysis
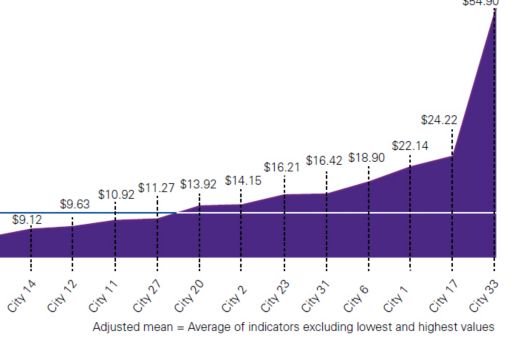
Efficiency
Operating and capital cost per hectare of park. This measure combines the total operating costs with the total capital costs and divides the total amount by the number of reported hectares of park within the city.
Points to consider:
- The high cost of US$55,000/hectare does not appear to be an aberration but clearly this city spends considerably more on operating and capital costs than any other city — are parks more precious in this city?
- Is US$3,250/hectare far too low, or has this city actually sought out revolutionary cost saving measures to reduce operating and capital costs?
- Is US$13,000/hectare on average enough or should it be higher to cover off park infrastructure that may be in severe need of replacement or refurbishment?
- Differences in park costs can be attributed to different types of park that comprise a city’s portfolio. If a city had a higher than average number of parks as unmaintained woodlots, ravines or bush lands, then their costs would be lower than a city with high maintenance sports fields in their portfolio.
Operating and capital cost per hectare of park (000 US$)
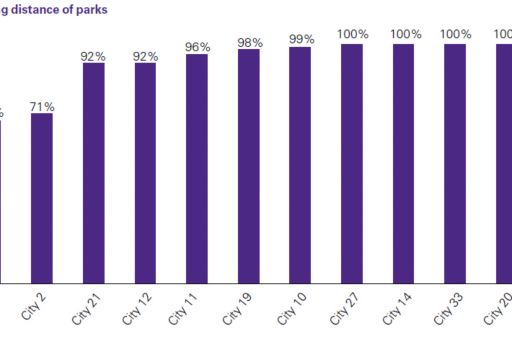
Effectiveness
Percent of residents within walking distance of parks. This measure indicates the accessibility of parks as a percentage of the total city population that lives within 800 meters (approximately a 10-minute walk) of a park.
Points to consider:
- Regarding the percent of parks within walking distance of residents, ideally every city would be at 100 percent. Of the 13 cities that responded, more than half of the cities have achieved this goal.
- Two cities fall below this target by a substantial margin at 14 percent and 21 percent respectively. Furthermore the city has access to inland national parks that are clearly not part of the city’s service offering but would also increase the accessibility to parks within a reasonable walking distance. The other city with 21 percent of residents within walking distance likely does not include large tracts of land that are woodlots that are liberally located throughout the city and along its fringes.
- While the relative location of parks to residents is an important statistic, ideally cities would like a better idea of how many of these residents actually used the parks. KPMG attempted to capture the number of park users per annum but few cities could report this statistic. With the advent of new technology, some cities are exploring how they can capture such information either through mobile technology or “trip counters” located at strategic locations throughout the park.
Percent of residents within walking distance of parks
Persistent problems
- Changing demographics and park usage requirements
- Improving the effectiveness and attractiveness of park features
- Securing experienced park design and development services
- Increasing demand for connectivity and ITC infrastructure within parks
- Creating shared funding mechanisms between governments
Common cost factors
- Type of parkland provided
- Sophistication and class of assets
- Maintenance requirements (grass cutting, horticultural care)
- Energy and input costs (fertilizer, etc.)
- Climate and topography
Innovative ideas
- WiFi and internet nodes have been installed in city parks in many cities including Adelaide and Moscow in order to encourage increased usage, particularly by millennials.
- Parks staff working for the Sunshine Coast authorities are enabled with mobile technologies that allow them to report and receive work orders while roaming on park sites.
- In Moscow, parks authorities are testing a variety of new park uses including providing places for psychological rest (such as paths created especially for barefoot walking), ethnographic discovery (a place for cultural dialogue) and ‘extreme’ amusement parks.
- In an effort to broaden access to parks in Cape Town, authorities have developed a ‘Smart Parks’ program that takes a principles-driven, community-centered and sustainable approach to the development of parks facilities.
- The city of Kazan has increased total park space by 50 percent over the past four years through the parks and public gardens project that saw the development of more than 50 new parks ‘from scratch’.
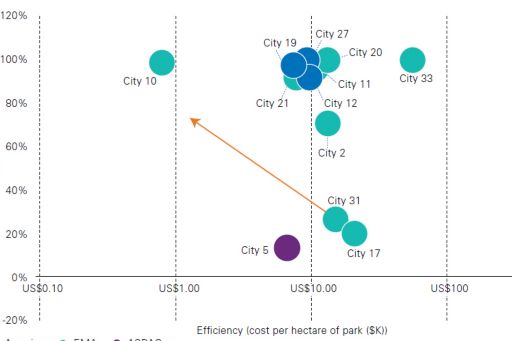
Combined efficiency and effectiveness analysis
Points to consider:
- A new performance perspective on parks combines both one efficiency and one effectiveness indicator. In this example, the cost per hectare of park (efficiency) is combined with the percent of parks within walking distance (effectiveness). Twelve cities provided sufficient information to generate this fascinating picture of parks.
- It is significant to note that there appears to be a cluster of cities that provide 100 percent (or nearly 100 percent) of their parks within walking distance at a price point of US$8,000–US$14,000 per hectare of park. City 10 boasts 100 percent coverage at less than US$1,000 per hectare but this requires closer scrutiny. If it stands the test of further analysis then City 10 can provide lessons to other cities about how to become more efficient.
- City 33 may wish to focus on reducing costs while maintaining its “walk to park” appeal. Meanwhile, City 17 may be spending the right amount of money but access to parks appears to be an issue and there is room for improvement.
- As previously mentioned, the context in which a city operates its own parks relative to other natural features (i.e. beaches, national parks) can directly influence costs and ease of access to parks. Sometimes this context is forgotten in the benchmarking comparisons and lends itself to incorrect conclusions about efficiency and effectiveness.
- As the number of cities involved in such benchmarking studies expands, we believe that greater insights will be forthcoming.
Park access - combined efficiency and effectiveness